 8
8peptides
spectra
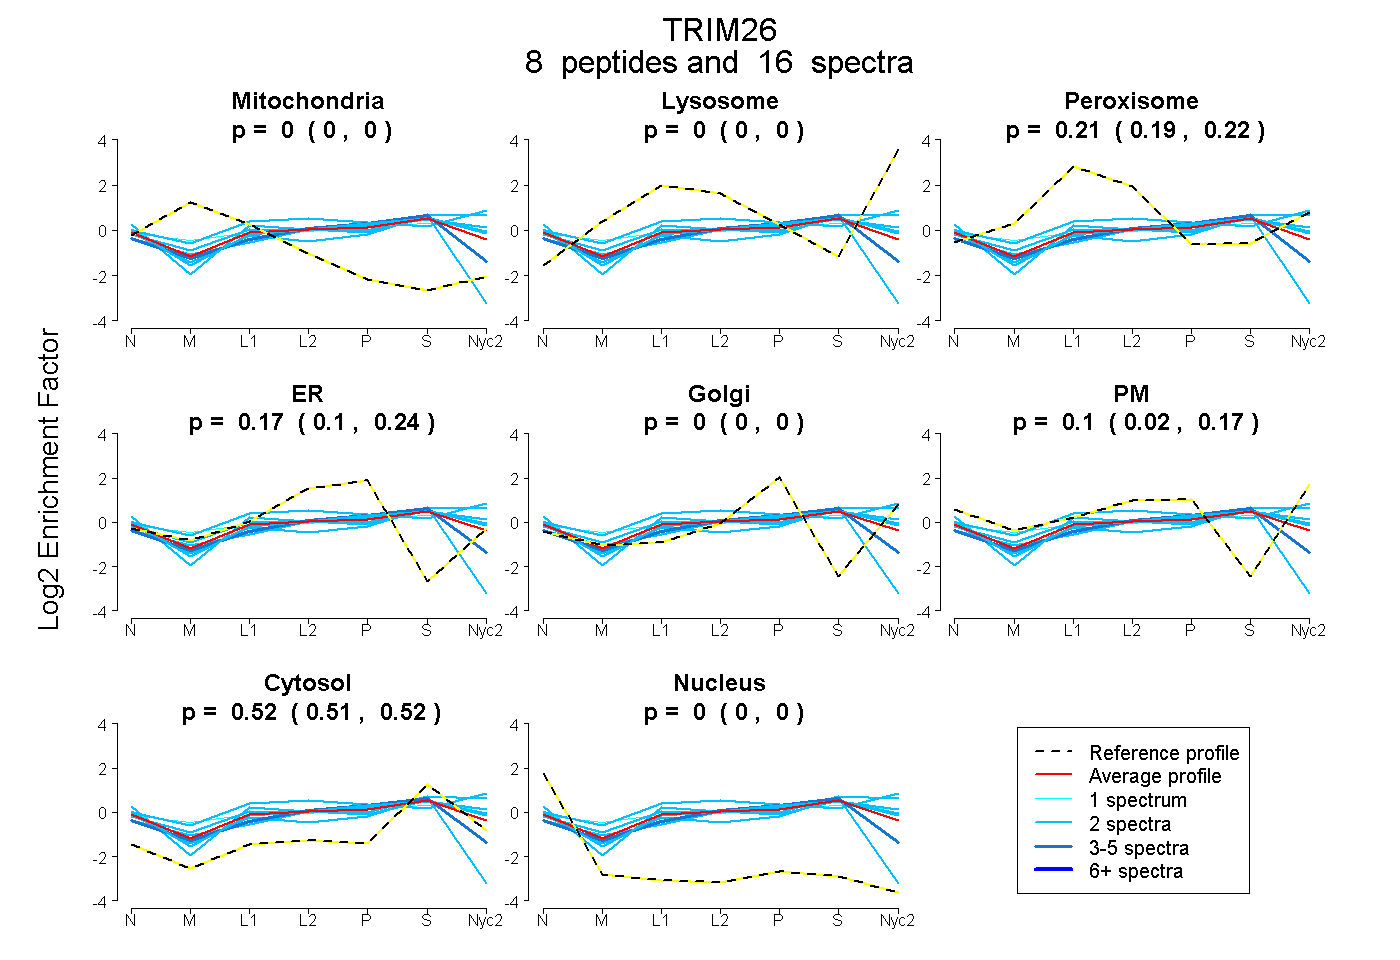
0.000 | 0.000
0.000 | 0.000
0.193 | 0.221
0.099 | 0.235
0.000 | 0.000
0.018 | 0.173
0.506 | 0.524
0.000 | 0.001
3peptides
spectra
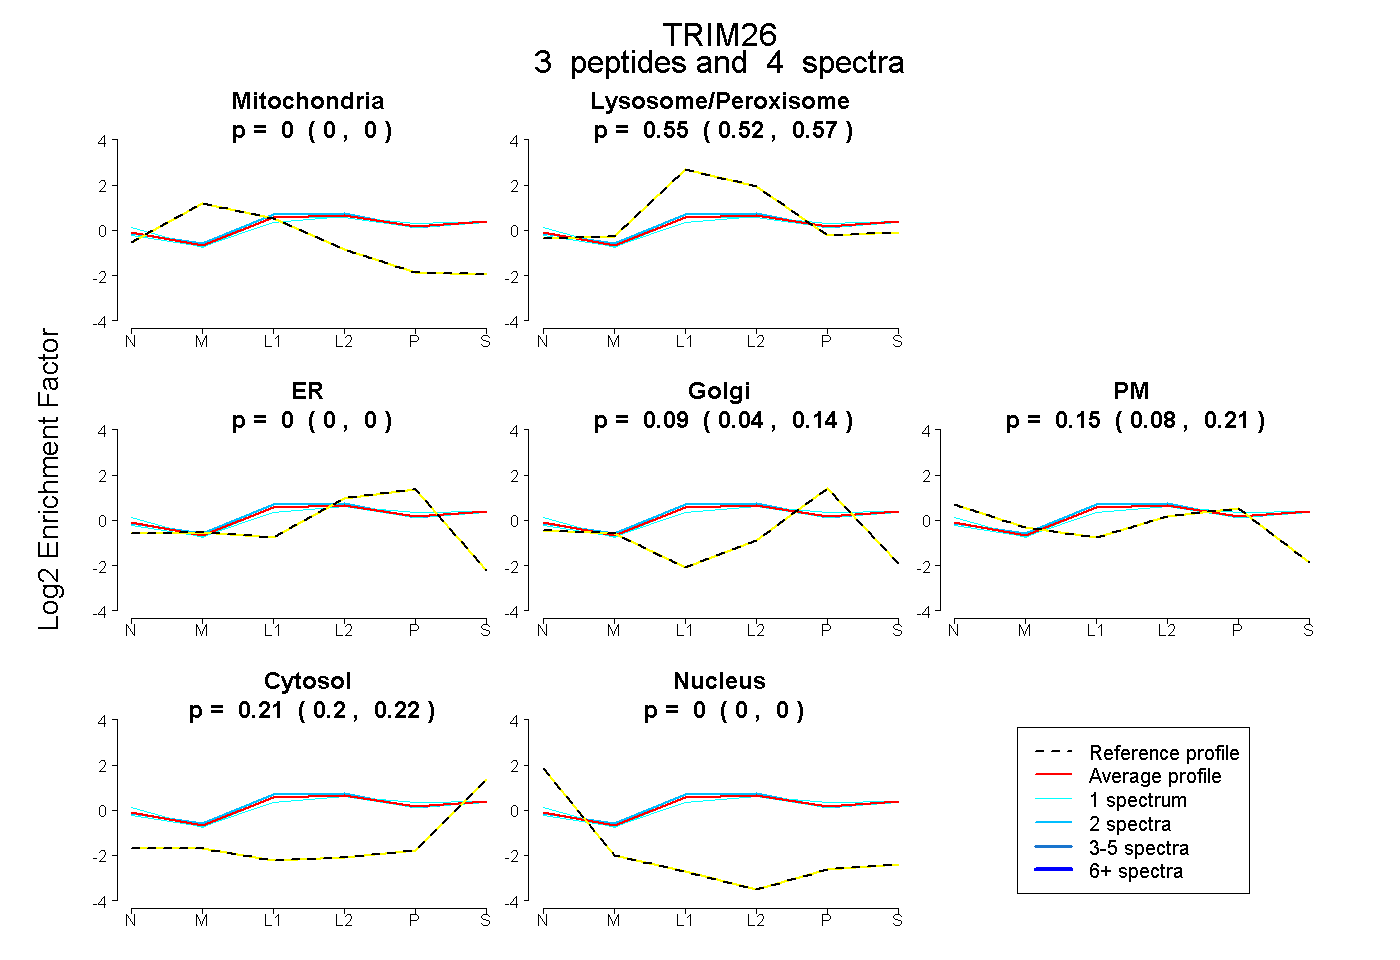
0.000 | 0.000
0.523 | 0.572
0.000 | 0.000
0.037 | 0.138
0.078 | 0.206
0.197 | 0.223
0.000 | 0.000
6peptides
spectra
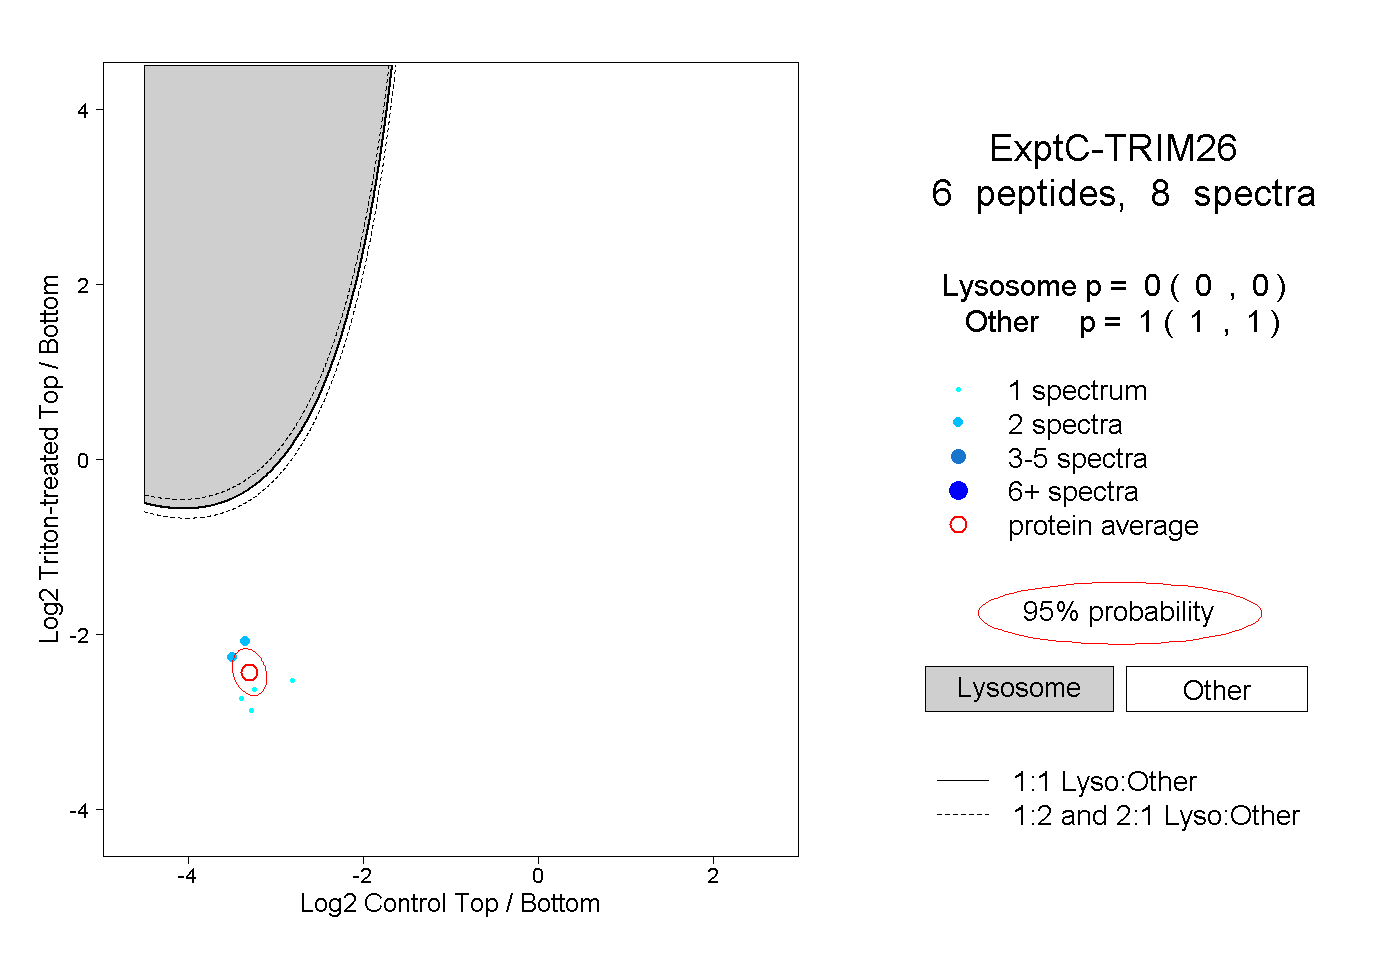
0.000 | 0.000
1.000 | 1.000
2peptides
spectra
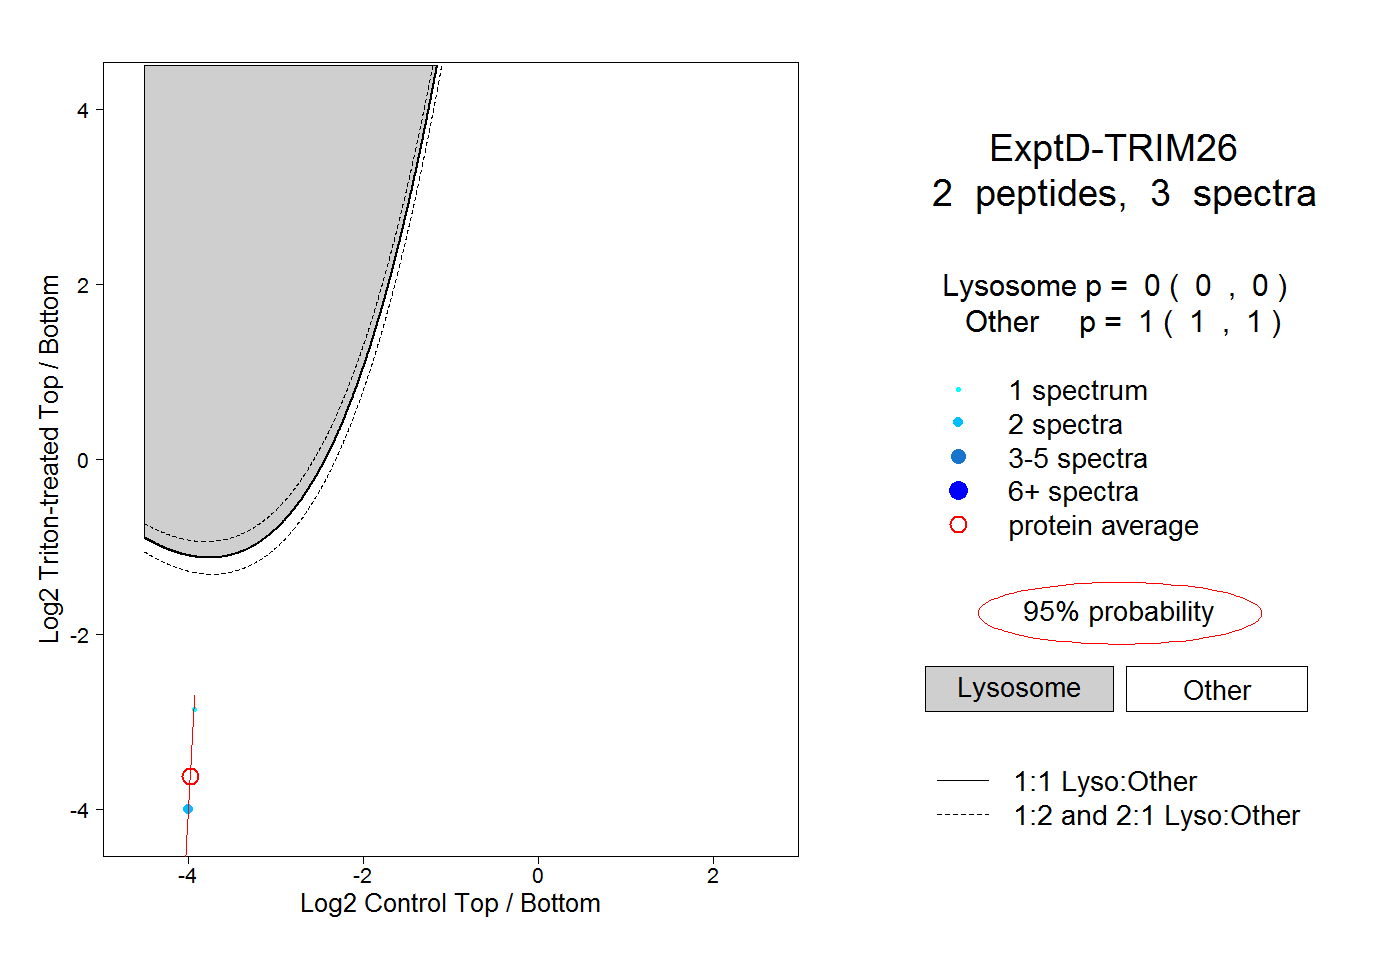
0.000 | 0.000
1.000 | 1.000