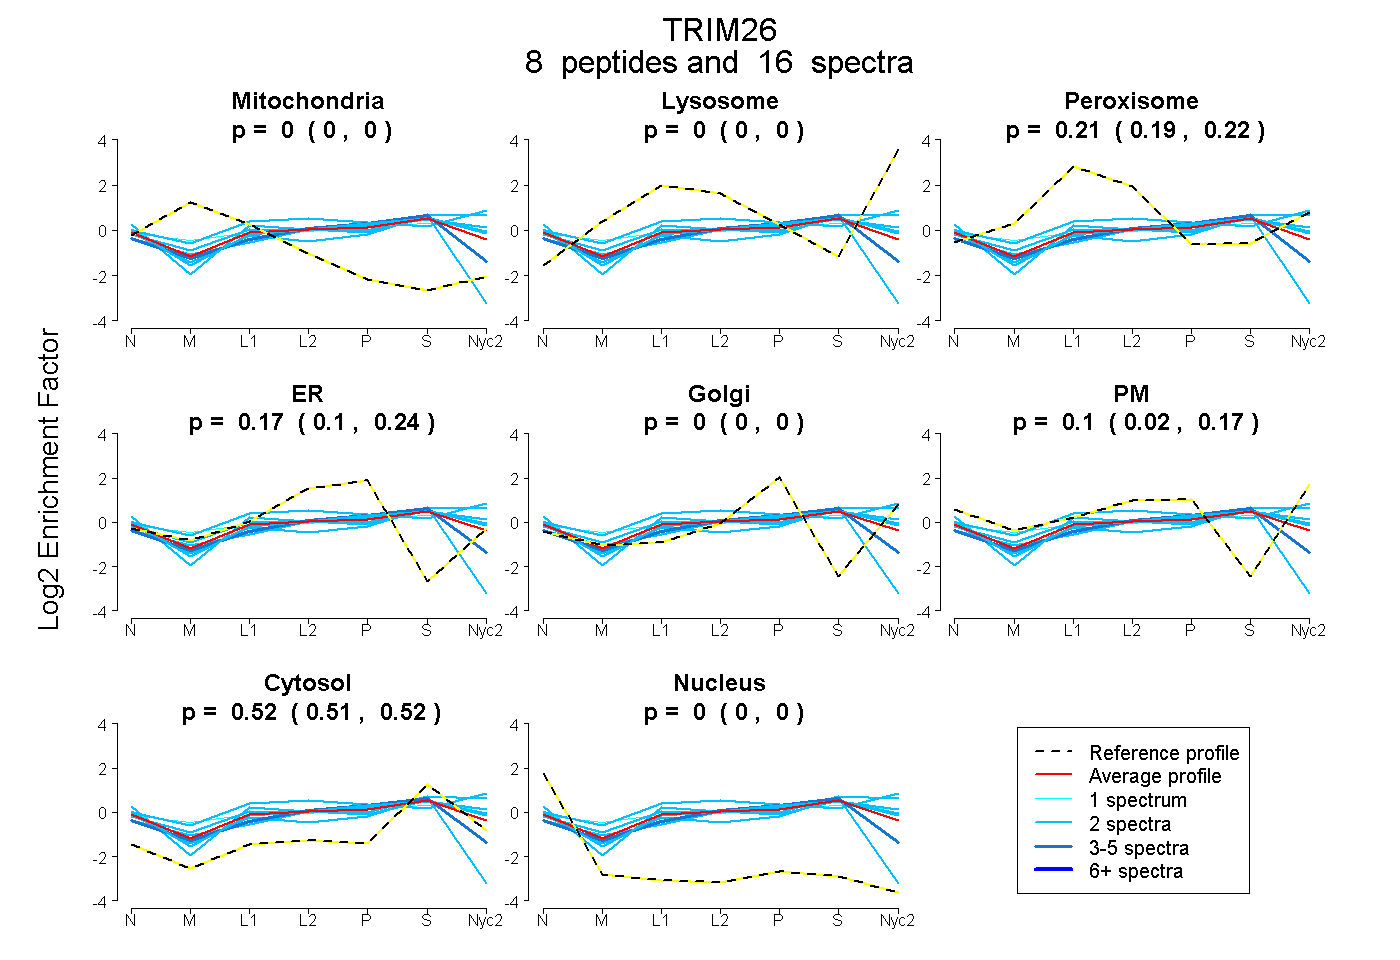
 8
8peptides
spectra
0.000 | 0.000
0.000 | 0.000
0.193 | 0.221
0.099 | 0.235
0.000 | 0.000
0.018 | 0.173
0.506 | 0.524
0.000 | 0.001
| Plot | Mito | Lyso | Perox | ER | Golgi | PM | Cytosol | Nucleus | |||||
| Expt A |
8 peptides |
16 spectra |
|
0.000 0.000 | 0.000 |
0.000 0.000 | 0.000 |
0.208 0.193 | 0.221 |
0.175 0.099 | 0.235 |
0.000 0.000 | 0.000 |
0.101 0.018 | 0.173 |
0.516 0.506 | 0.524 |
0.000 0.000 | 0.001 |
| 2 spectra, AALPHR | 0.000 | 0.000 | 0.214 | 0.042 | 0.000 | 0.206 | 0.534 | 0.003 | ||
| 2 spectra, LTLVISELEGK | 0.000 | 0.000 | 0.141 | 0.102 | 0.000 | 0.238 | 0.519 | 0.000 | ||
| 2 spectra, QGHQFLK | 0.000 | 0.000 | 0.283 | 0.000 | 0.138 | 0.135 | 0.444 | 0.000 | ||
| 1 spectrum, AIPHMVK | 0.007 | 0.000 | 0.254 | 0.000 | 0.103 | 0.215 | 0.421 | 0.000 | ||
| 2 spectra, DPVTIDCGHVFCR | 0.114 | 0.000 | 0.081 | 0.160 | 0.000 | 0.000 | 0.514 | 0.131 | ||
| 2 spectra, ILNHLNTLR | 0.000 | 0.051 | 0.273 | 0.000 | 0.000 | 0.352 | 0.324 | 0.000 | ||
| 2 spectra, IQGFQAK | 0.000 | 0.127 | 0.055 | 0.000 | 0.000 | 0.273 | 0.546 | 0.000 | ||
| 3 spectra, LLCVMCR | 0.000 | 0.000 | 0.105 | 0.321 | 0.000 | 0.000 | 0.575 | 0.000 |
| Plot | Mito | Lyso or Perox | ER | Golgi | PM | Cytosol | Nucleus | ||||||
| Expt B |
3 peptides |
4 spectra |
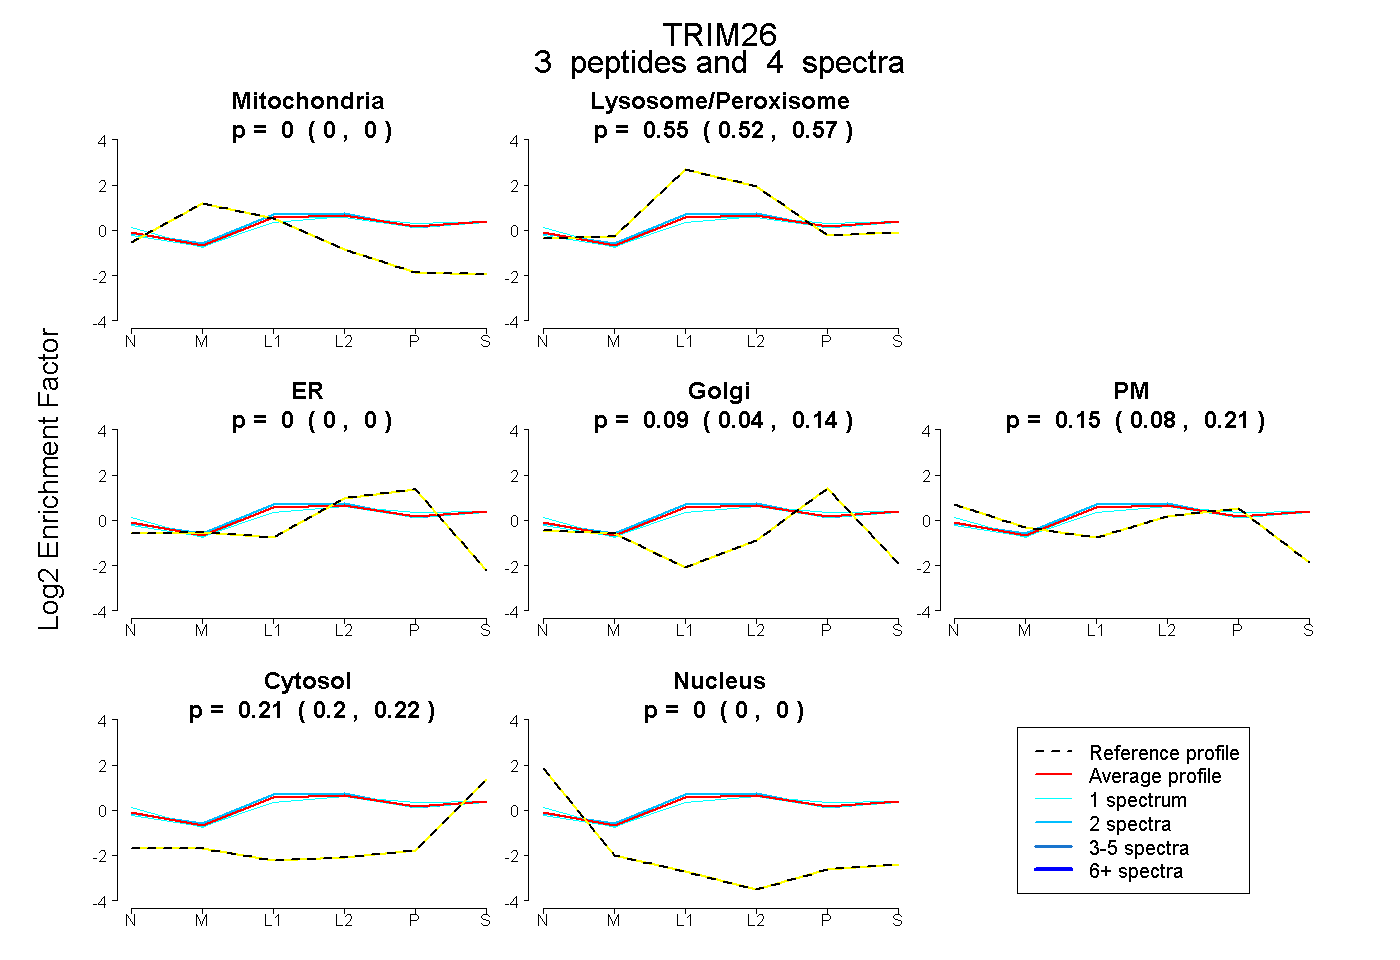 |
0.000 0.000 | 0.000 |
0.550 0.523 | 0.572 |
0.000 0.000 | 0.000 |
0.093 0.037 | 0.138 |
0.146 0.078 | 0.206 |
0.211 0.197 | 0.223 |
0.000 0.000 | 0.000 |
|||
| Plot | Lyso | Other | |||||||||||
| Expt C |
6 peptides |
8 spectra |
 |
0.000 0.000 | 0.000 |
1.000 1.000 | 1.000 |
||||||||
| Plot | Lyso | Other | |||||||||||
| Expt D |
2 peptides |
3 spectra |
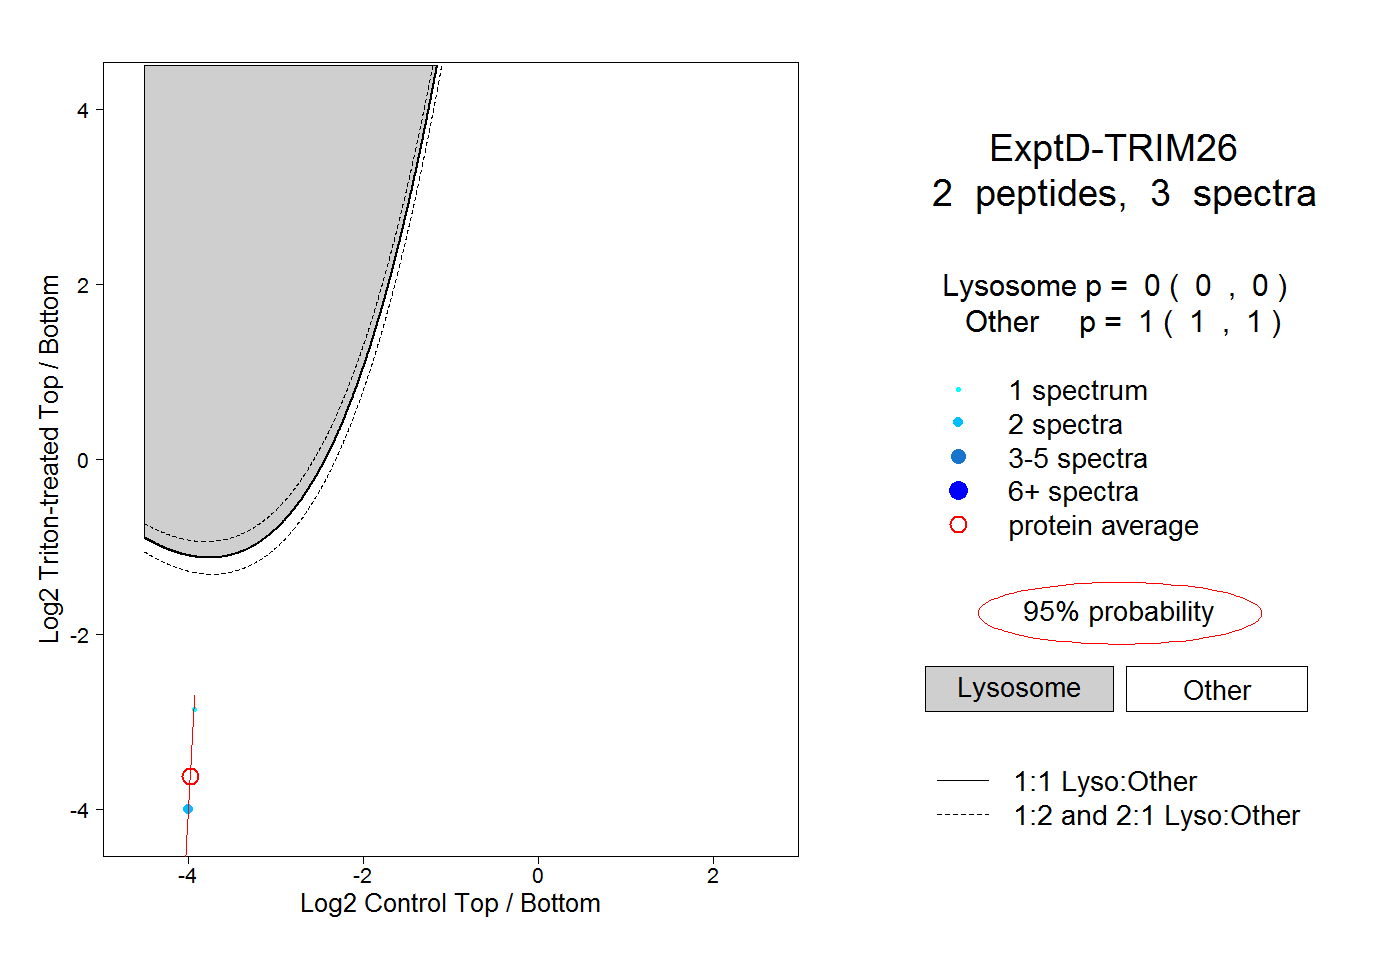 |
0.000 0.000 | 0.000 |
1.000 1.000 | 1.000 |