 4
4peptides
spectra
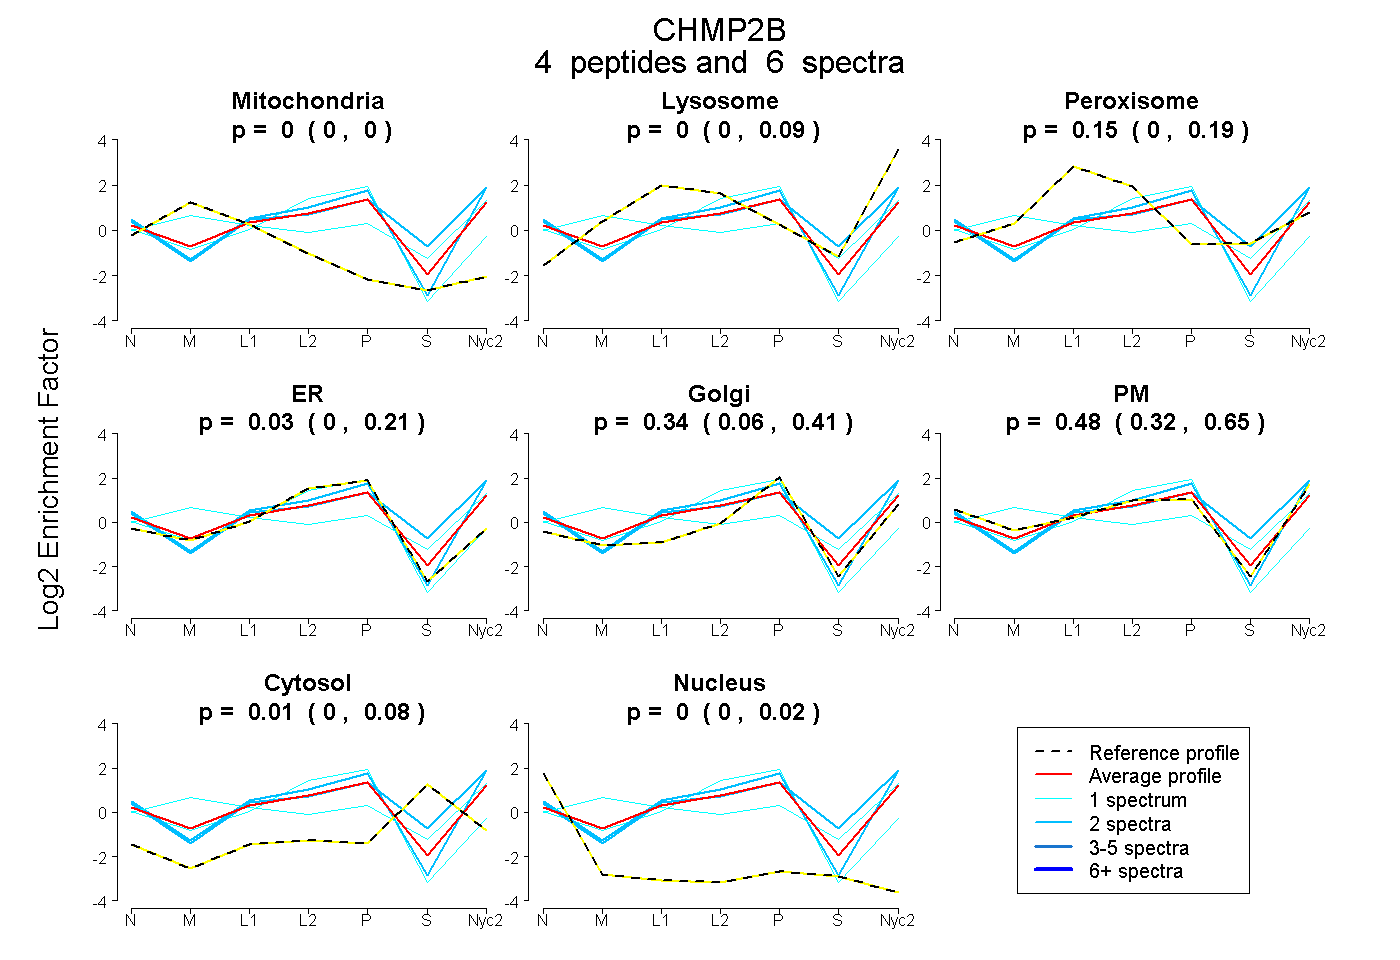
0.000 | 0.000
0.000 | 0.086
0.000 | 0.188
0.000 | 0.208
0.063 | 0.410
0.318 | 0.648
0.000 | 0.076
0.000 | 0.019
1peptide
spectra
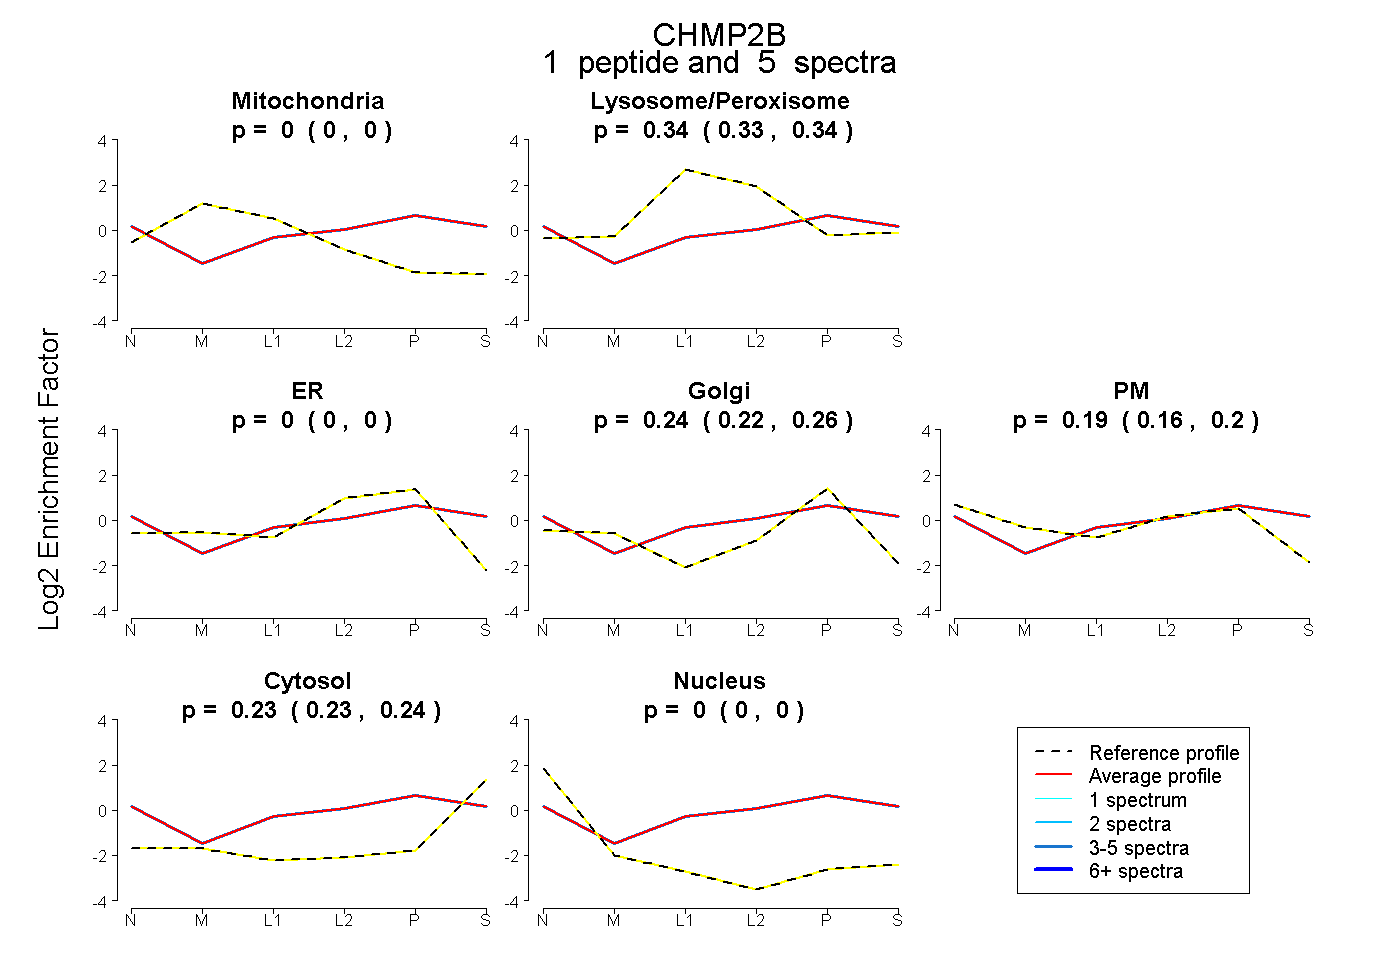
0.000 | 0.000
0.329 | 0.344
0.000 | 0.000
0.225 | 0.261
0.161 | 0.205
0.226 | 0.240
0.000 | 0.000
7peptides
spectra
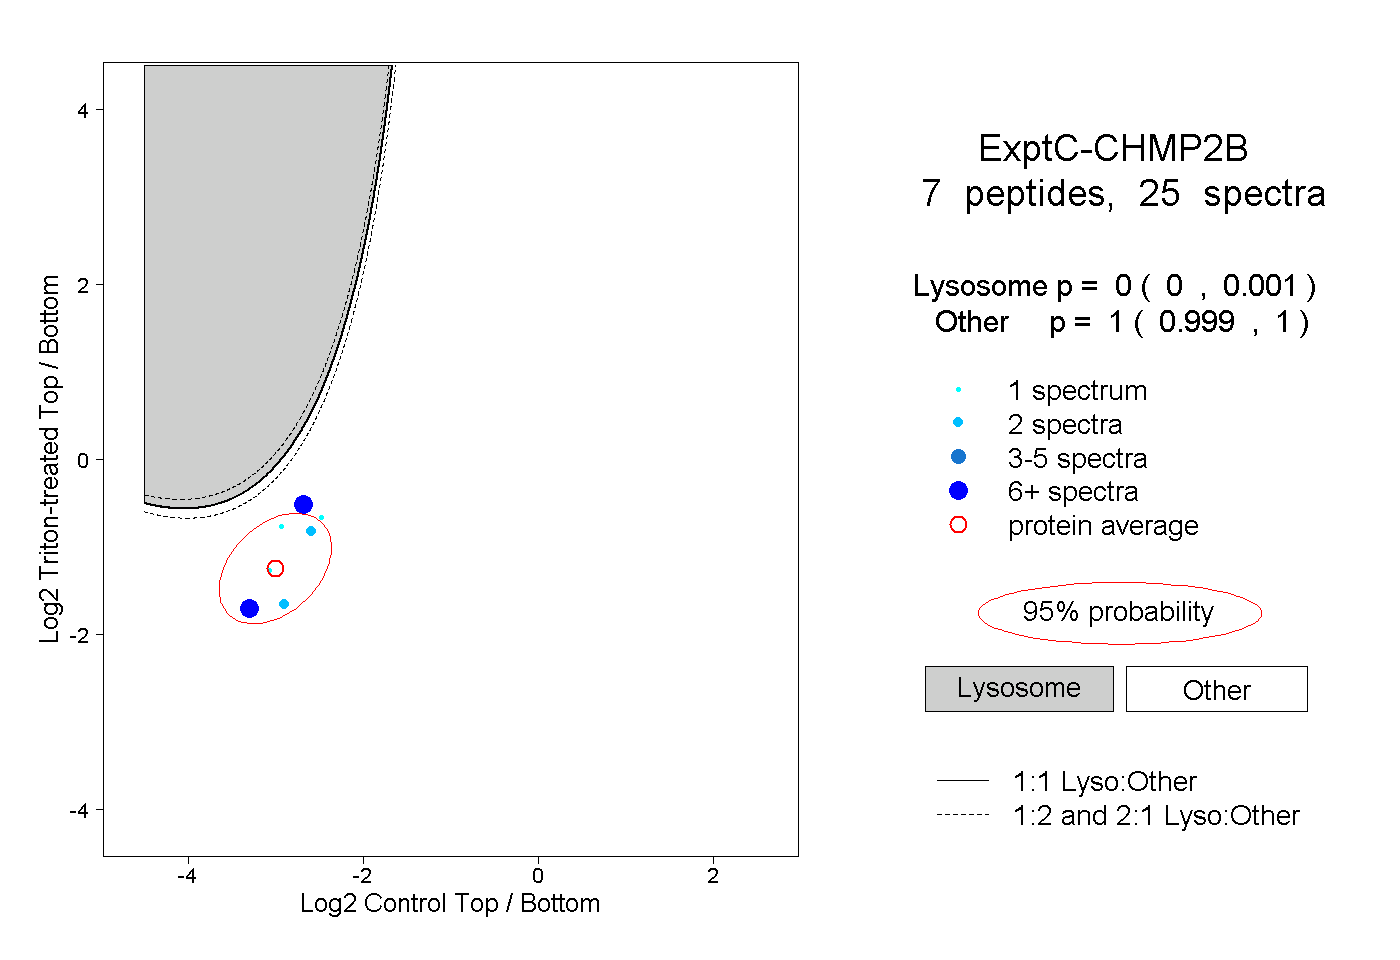
0.000 | 0.001
0.999 | 1.000
2peptides
spectra
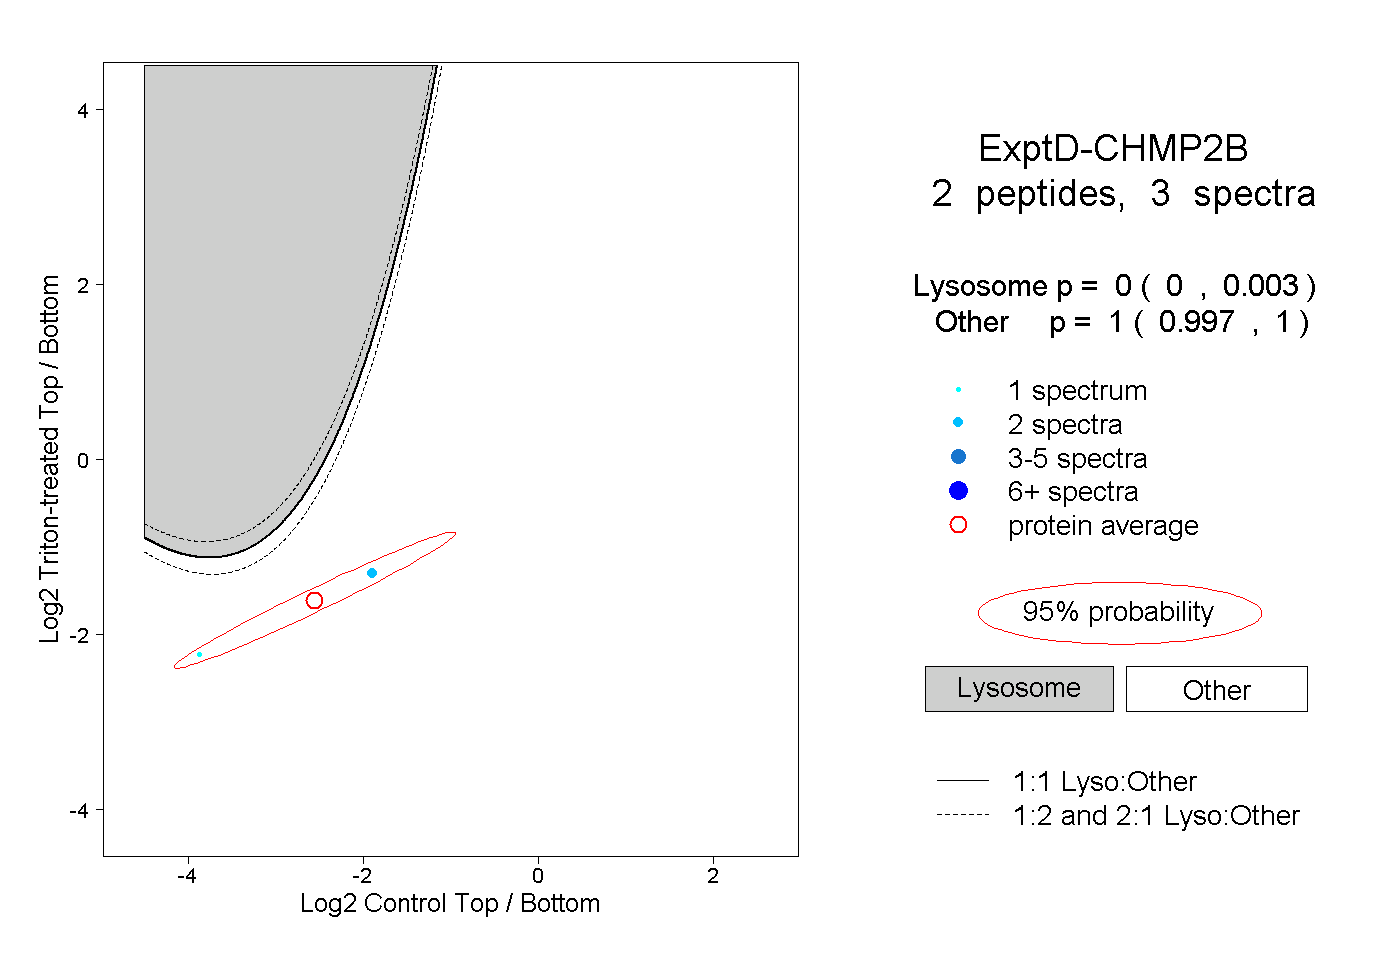
0.000 | 0.003
0.997 | 1.000