 4
4peptides
spectra
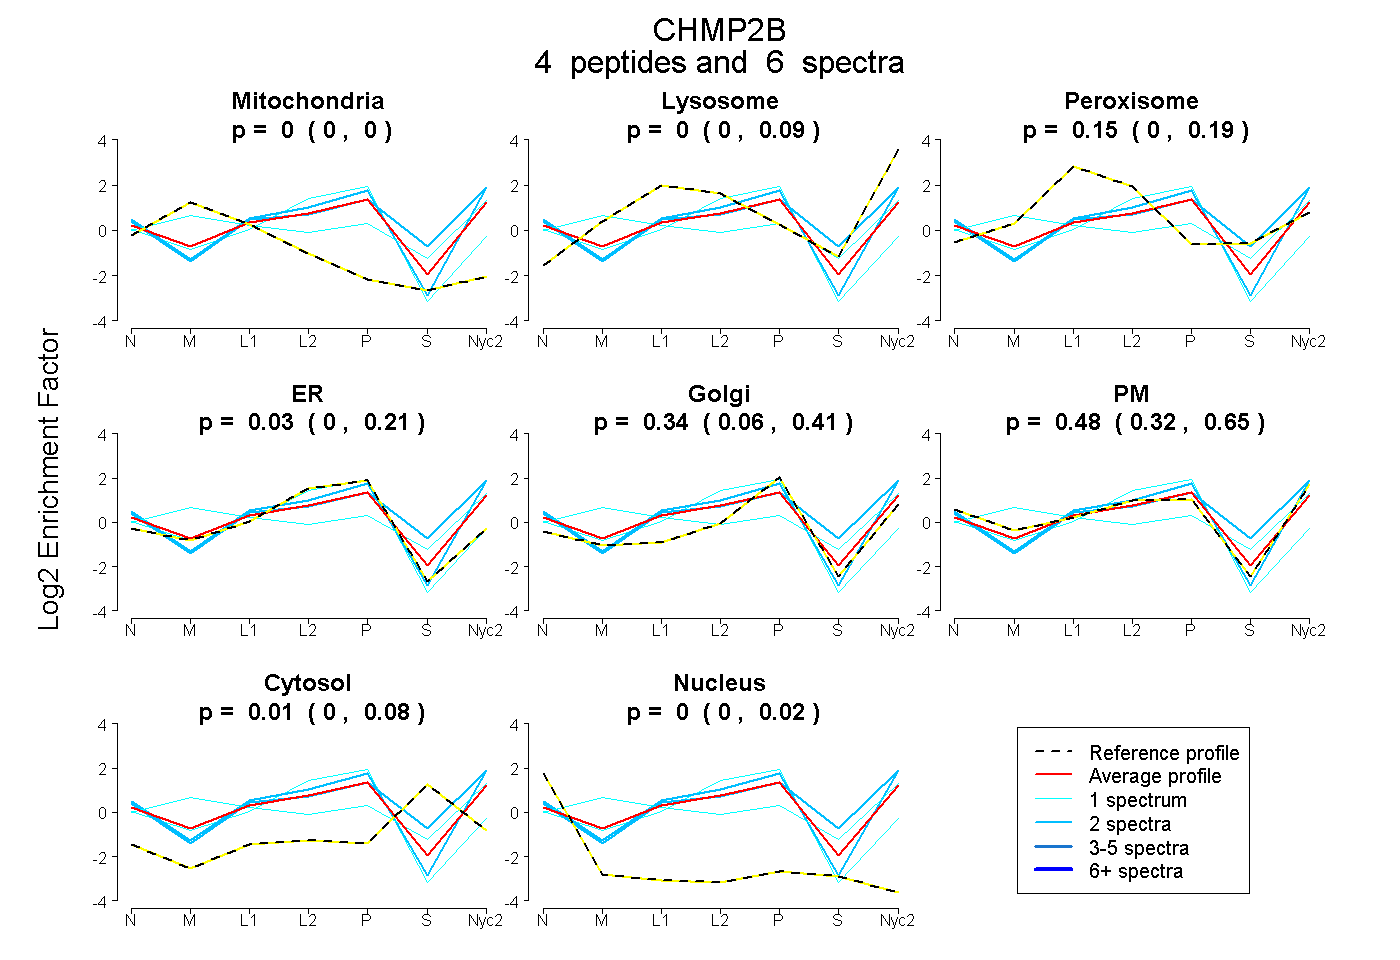
0.000 | 0.000
0.000 | 0.086
0.000 | 0.188
0.000 | 0.208
0.063 | 0.410
0.318 | 0.648
0.000 | 0.076
0.000 | 0.019
| Plot | Mito | Lyso | Perox | ER | Golgi | PM | Cytosol | Nucleus | |||||
| Expt A |
4 peptides |
6 spectra |
|
0.000 0.000 | 0.000 |
0.000 0.000 | 0.086 |
0.147 0.000 | 0.188 |
0.025 0.000 | 0.208 |
0.336 0.063 | 0.410 |
0.483 0.318 | 0.648 |
0.010 0.000 | 0.076 |
0.000 0.000 | 0.019 |
| 1 spectrum, ASLFK | 0.000 | 0.000 | 0.000 | 0.958 | 0.000 | 0.025 | 0.000 | 0.018 | ||
| 1 spectrum, TLQTMQNFQK | 0.213 | 0.258 | 0.000 | 0.000 | 0.078 | 0.357 | 0.095 | 0.000 | ||
| 2 spectra, QLVHLR | 0.000 | 0.000 | 0.000 | 0.061 | 0.109 | 0.831 | 0.000 | 0.000 | ||
| 2 spectra, ATISDEEIER | 0.000 | 0.169 | 0.000 | 0.000 | 0.052 | 0.601 | 0.178 | 0.000 |
| Plot | Mito | Lyso or Perox | ER | Golgi | PM | Cytosol | Nucleus | ||||||
| Expt B |
1 peptide |
5 spectra |
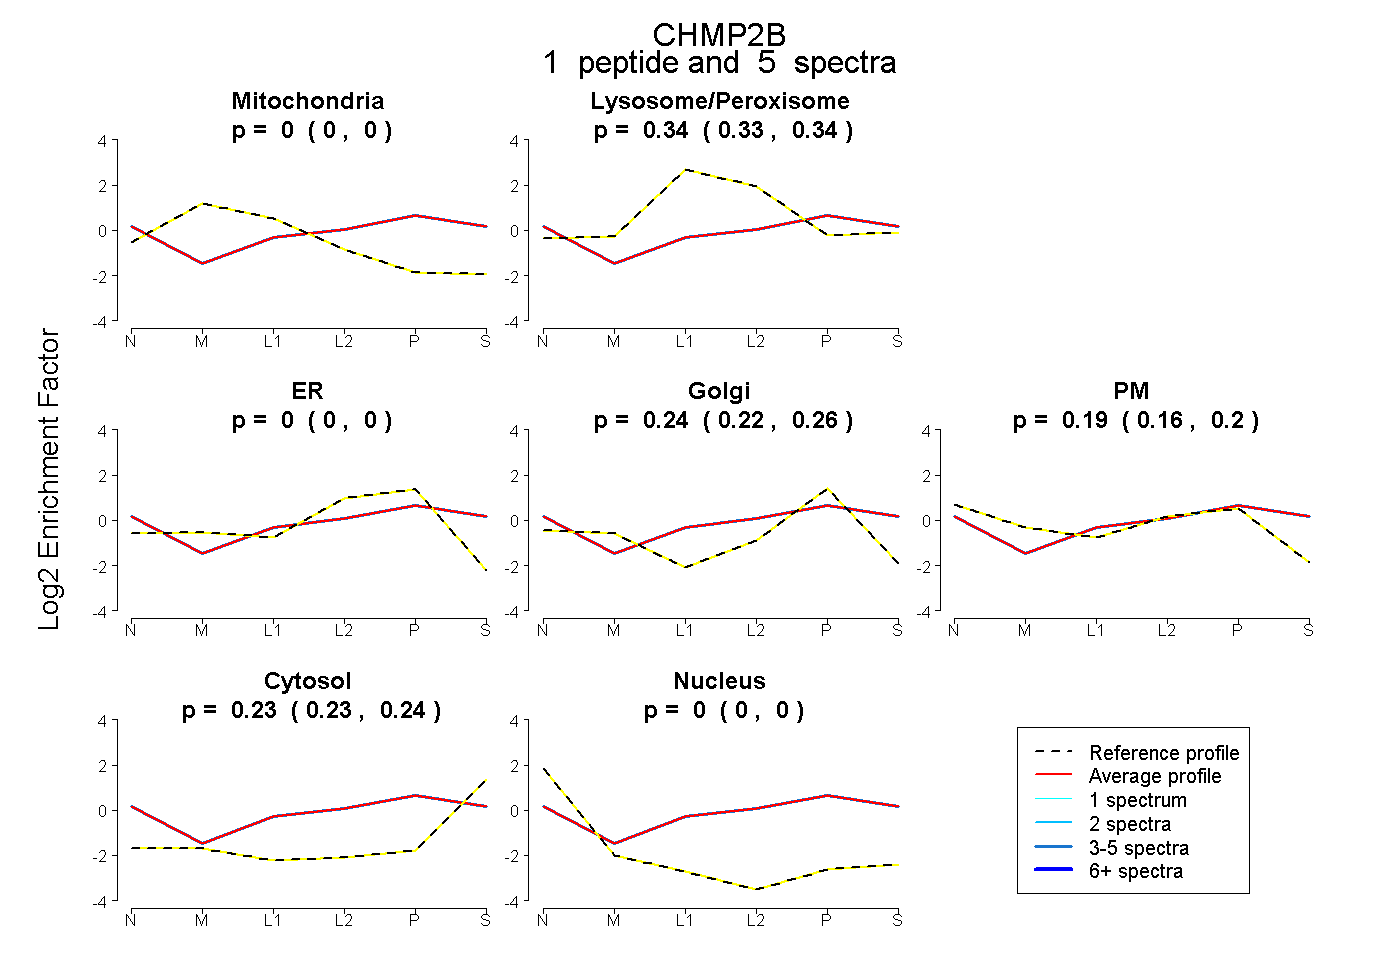 |
0.000 0.000 | 0.000 |
0.338 0.329 | 0.344 |
0.000 0.000 | 0.000 |
0.244 0.225 | 0.261 |
0.185 0.161 | 0.205 |
0.233 0.226 | 0.240 |
0.000 0.000 | 0.000 |
|||
| Plot | Lyso | Other | |||||||||||
| Expt C |
7 peptides |
25 spectra |
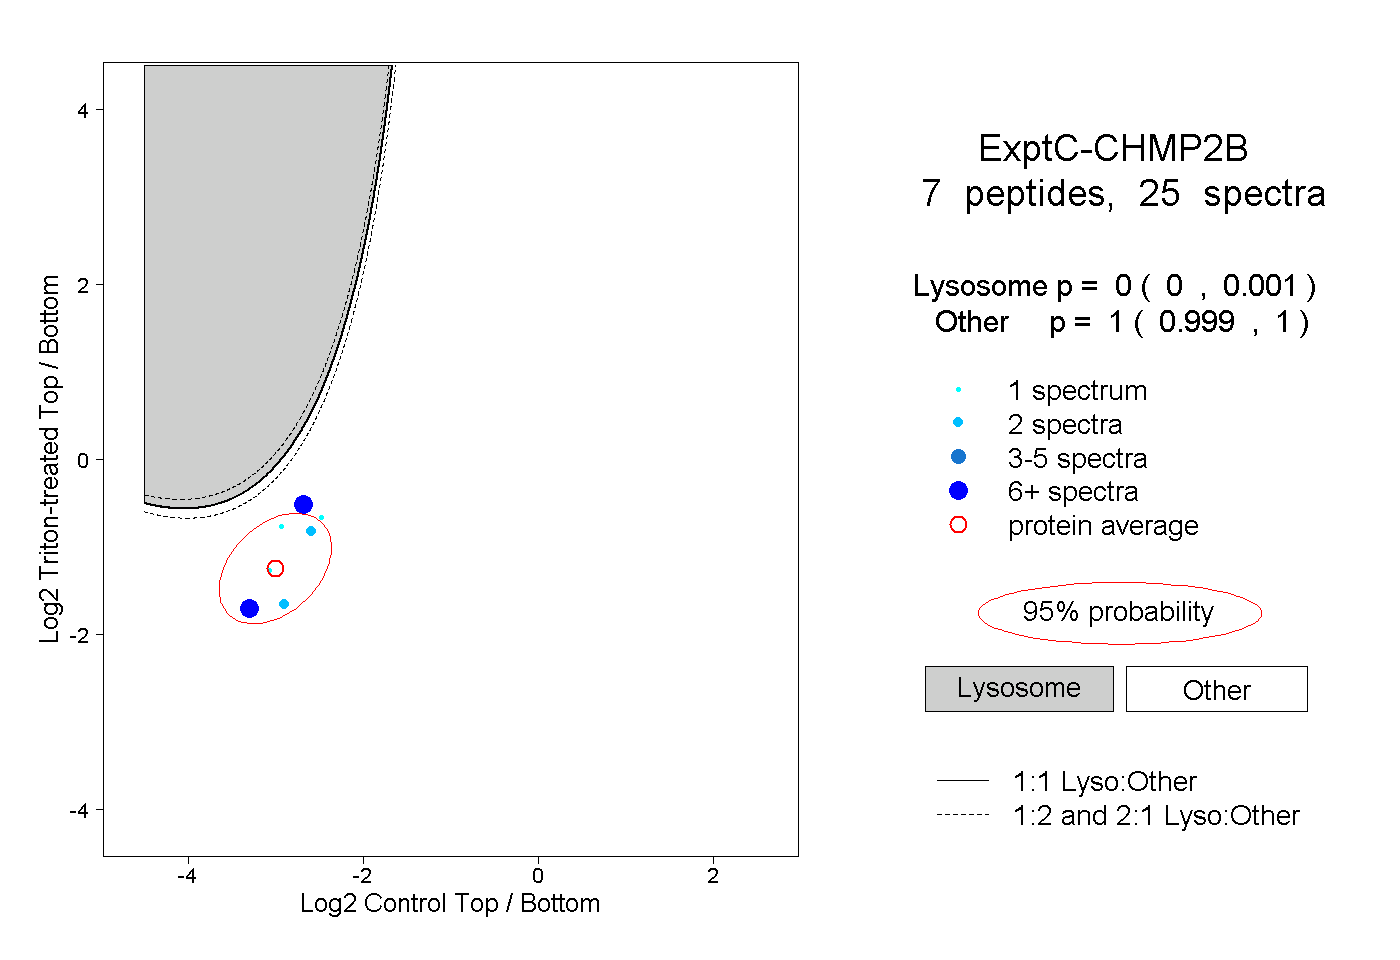 |
0.000 0.000 | 0.001 |
1.000 0.999 | 1.000 |
||||||||
| Plot | Lyso | Other | |||||||||||
| Expt D |
2 peptides |
3 spectra |
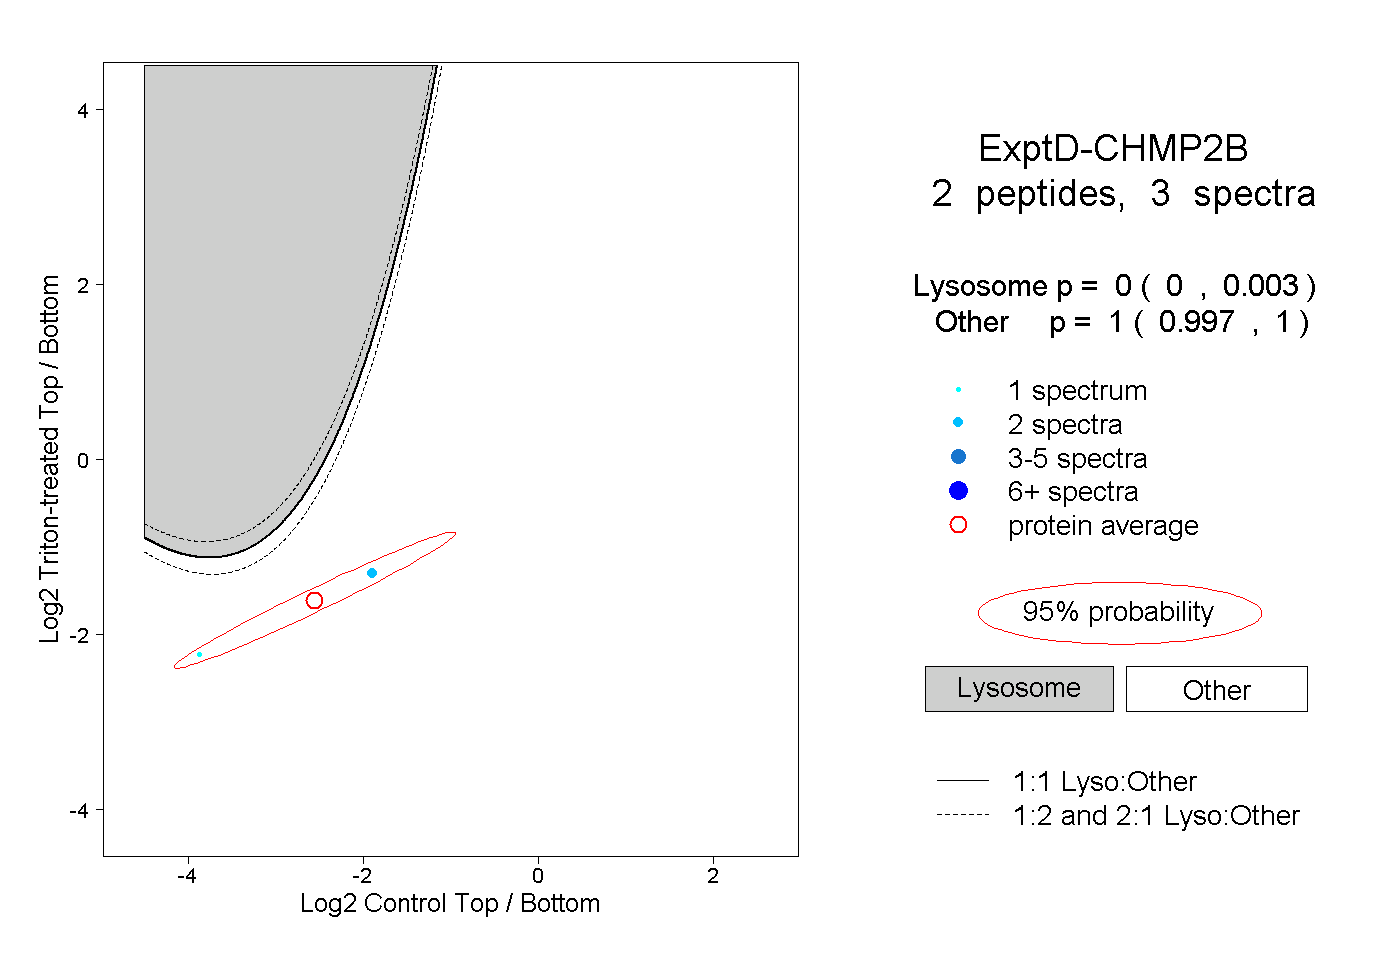 |
0.000 0.000 | 0.003 |
1.000 0.997 | 1.000 |