 5
5peptides
spectra
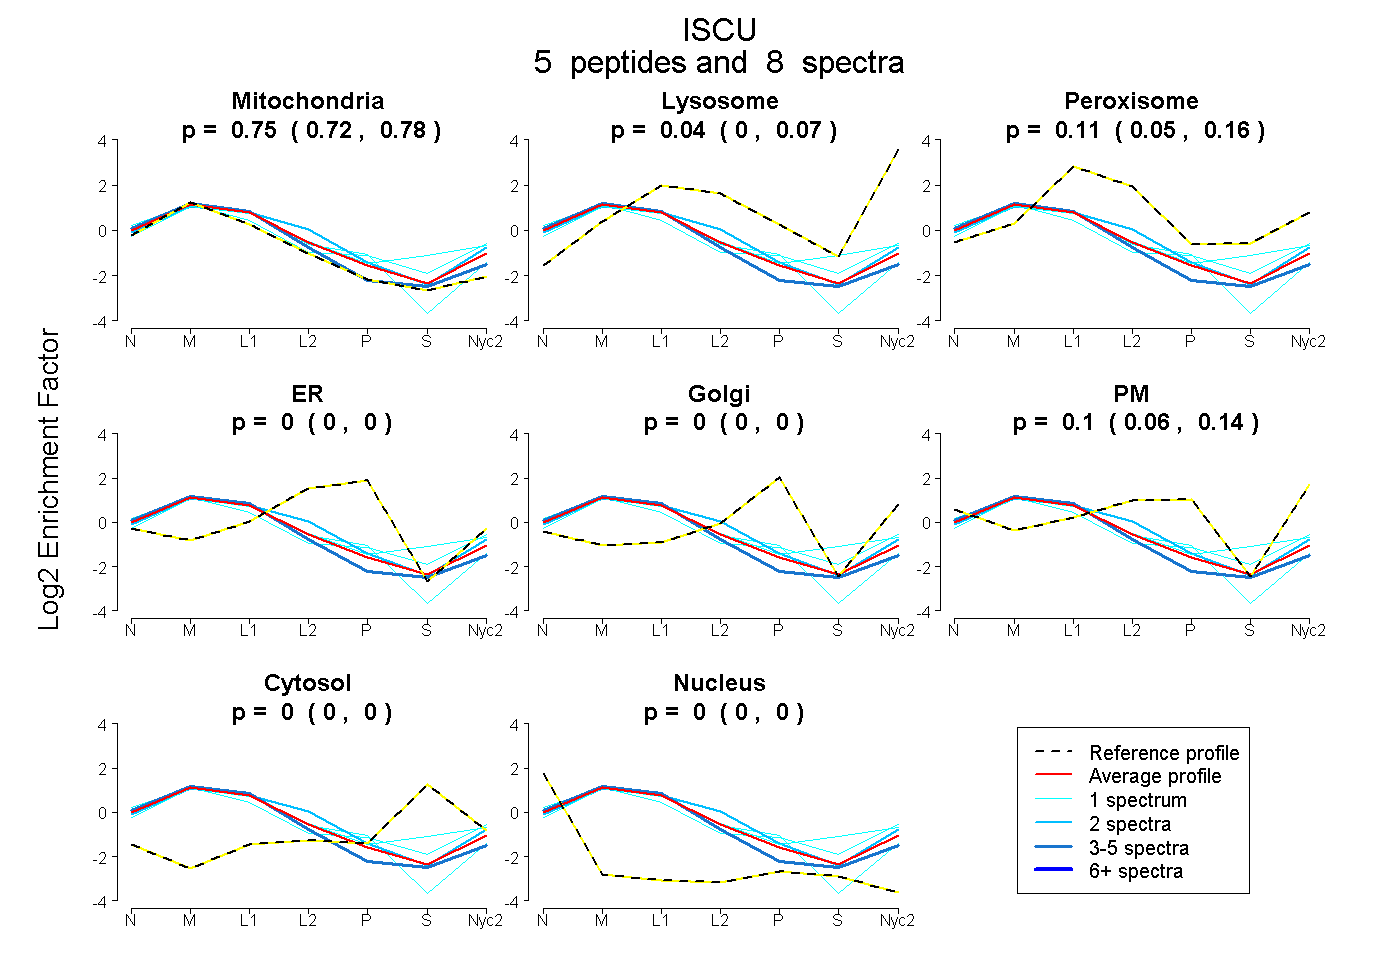
0.720 | 0.777
0.000 | 0.070
0.051 | 0.159
0.000 | 0.000
0.000 | 0.000
0.061 | 0.140
0.000 | 0.000
0.000 | 0.000
7peptides
spectra
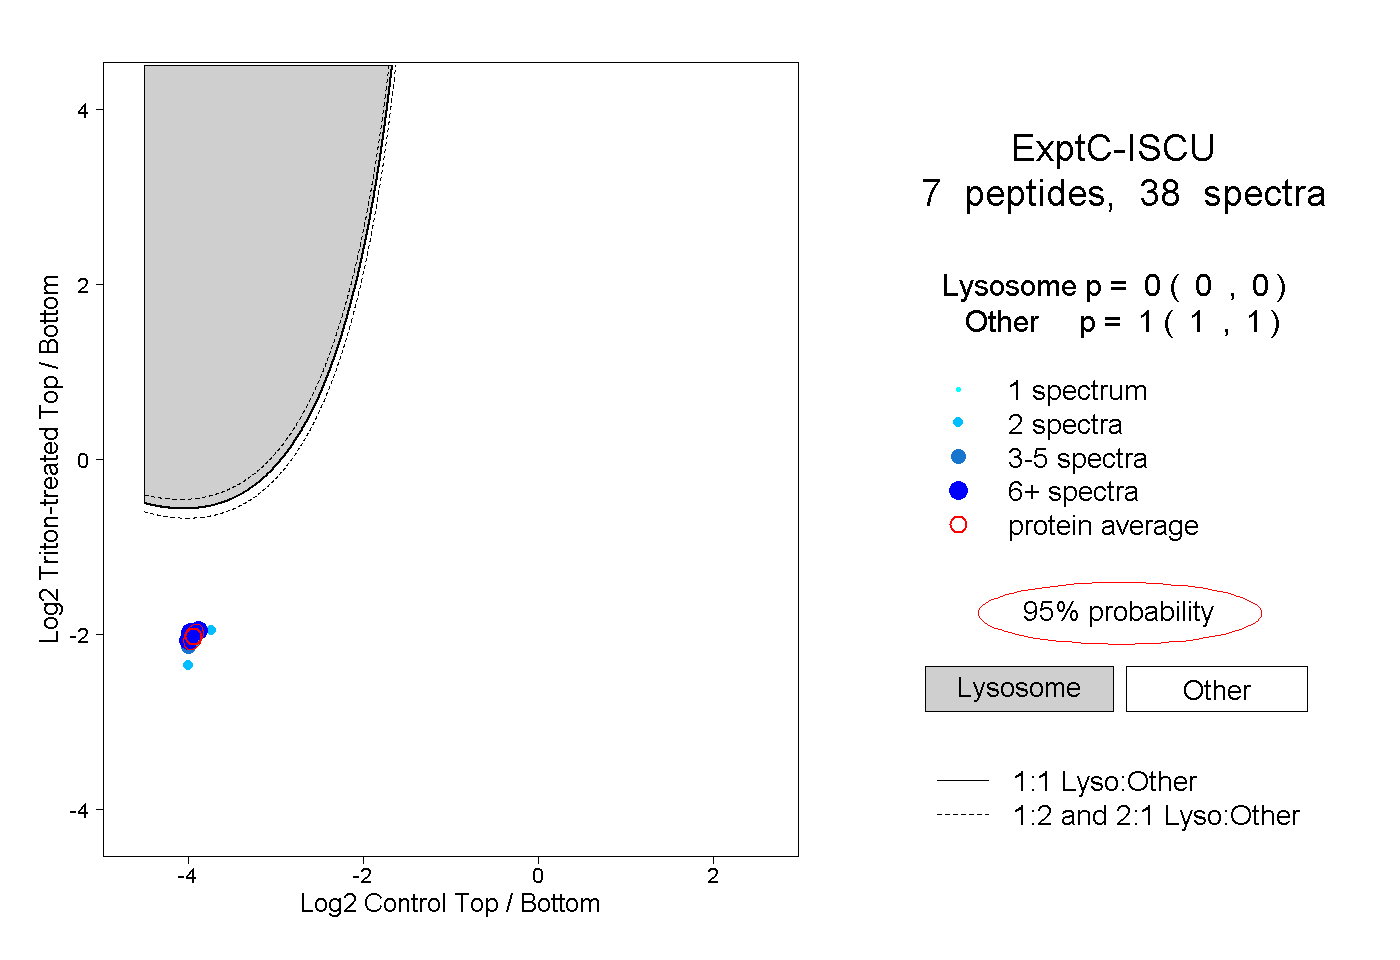
0.000 | 0.000
1.000 | 1.000
3peptides
spectra
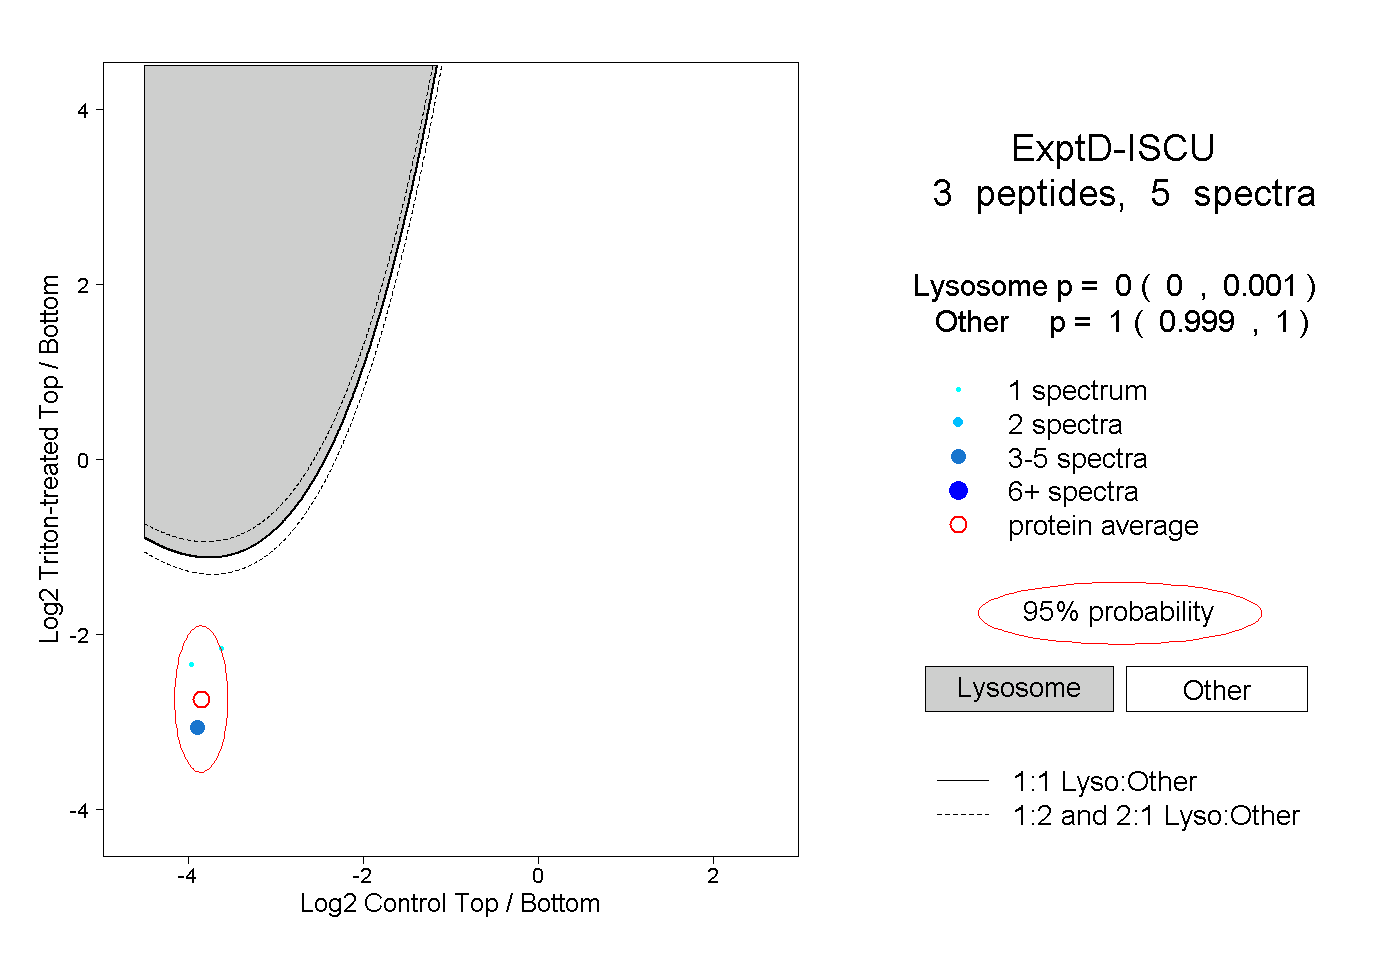
0.000 | 0.001
0.999 | 1.000