 5
5peptides
spectra
0.720 | 0.777
0.000 | 0.070
0.051 | 0.159
0.000 | 0.000
0.000 | 0.000
0.061 | 0.140
0.000 | 0.000
0.000 | 0.000
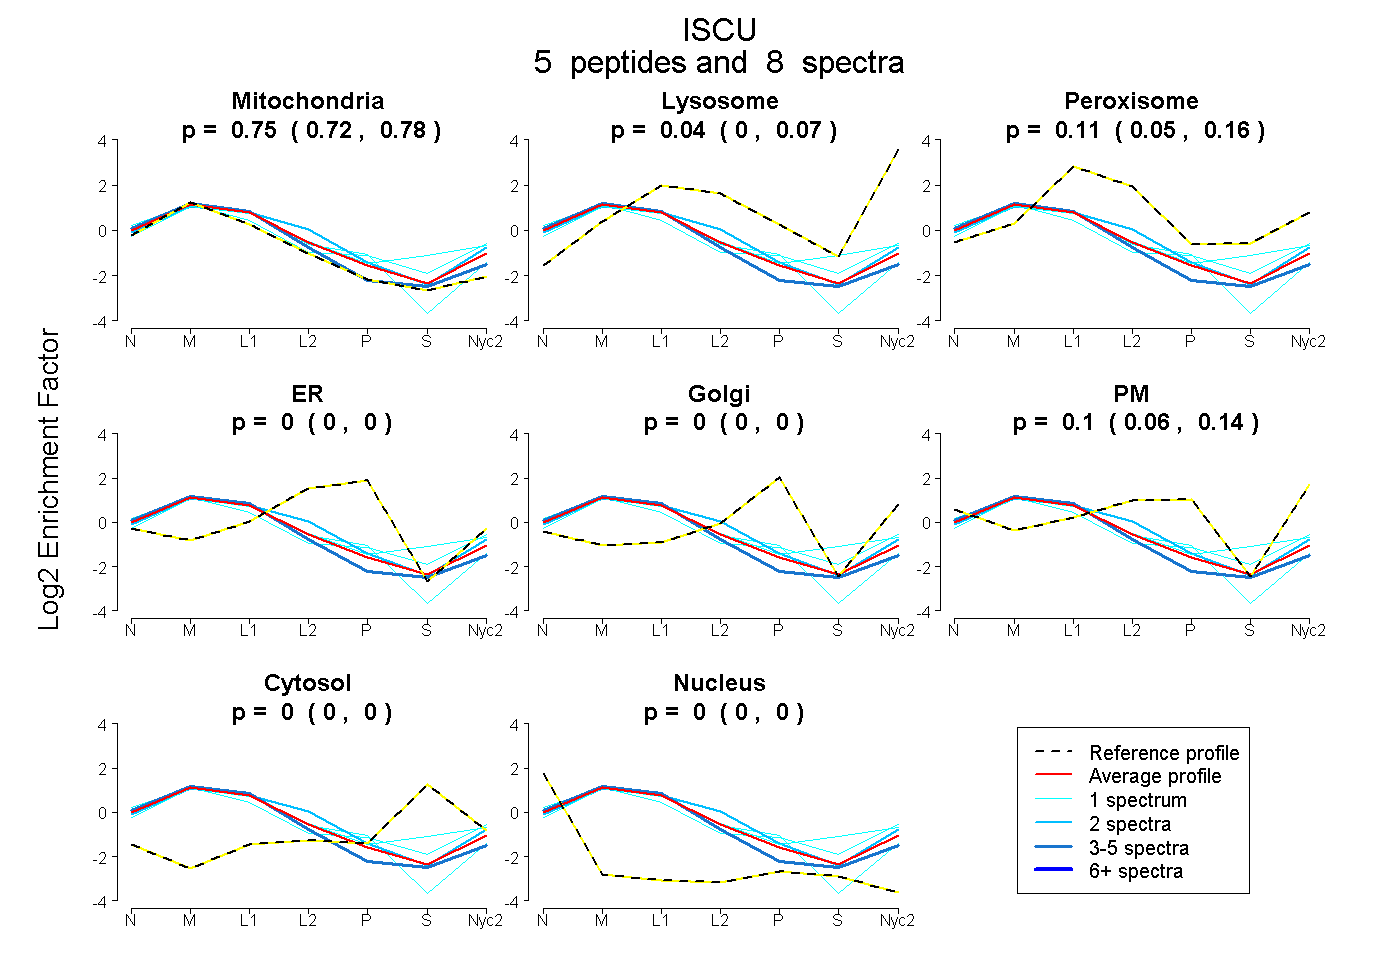
| Plot | Mito | Lyso | Perox | ER | Golgi | PM | Cytosol | Nucleus | |||||
| Expt A |
5 peptides |
8 spectra |
|
0.751 0.720 | 0.777 |
0.035 0.000 | 0.070 |
0.112 0.051 | 0.159 |
0.000 0.000 | 0.000 |
0.000 0.000 | 0.000 |
0.103 0.061 | 0.140 |
0.000 0.000 | 0.000 |
0.000 0.000 | 0.000 |
| 1 spectrum, LQIQVDEK | 0.767 | 0.000 | 0.000 | 0.099 | 0.000 | 0.134 | 0.000 | 0.000 | ||
| 1 spectrum, TFGCGSAIASSSLATEWVK | 0.581 | 0.085 | 0.217 | 0.000 | 0.000 | 0.000 | 0.117 | 0.000 | ||
| 2 spectra, NVGTGLVGAPACGDVMK | 0.647 | 0.028 | 0.173 | 0.000 | 0.000 | 0.151 | 0.000 | 0.000 | ||
| 1 spectrum, AALADYK | 0.686 | 0.139 | 0.000 | 0.000 | 0.030 | 0.103 | 0.042 | 0.000 | ||
| 3 spectra, VVDHYENPR | 0.871 | 0.000 | 0.129 | 0.000 | 0.000 | 0.000 | 0.000 | 0.000 |
| Plot | Lyso | Other | |||||||||||
| Expt C |
7 peptides |
38 spectra |
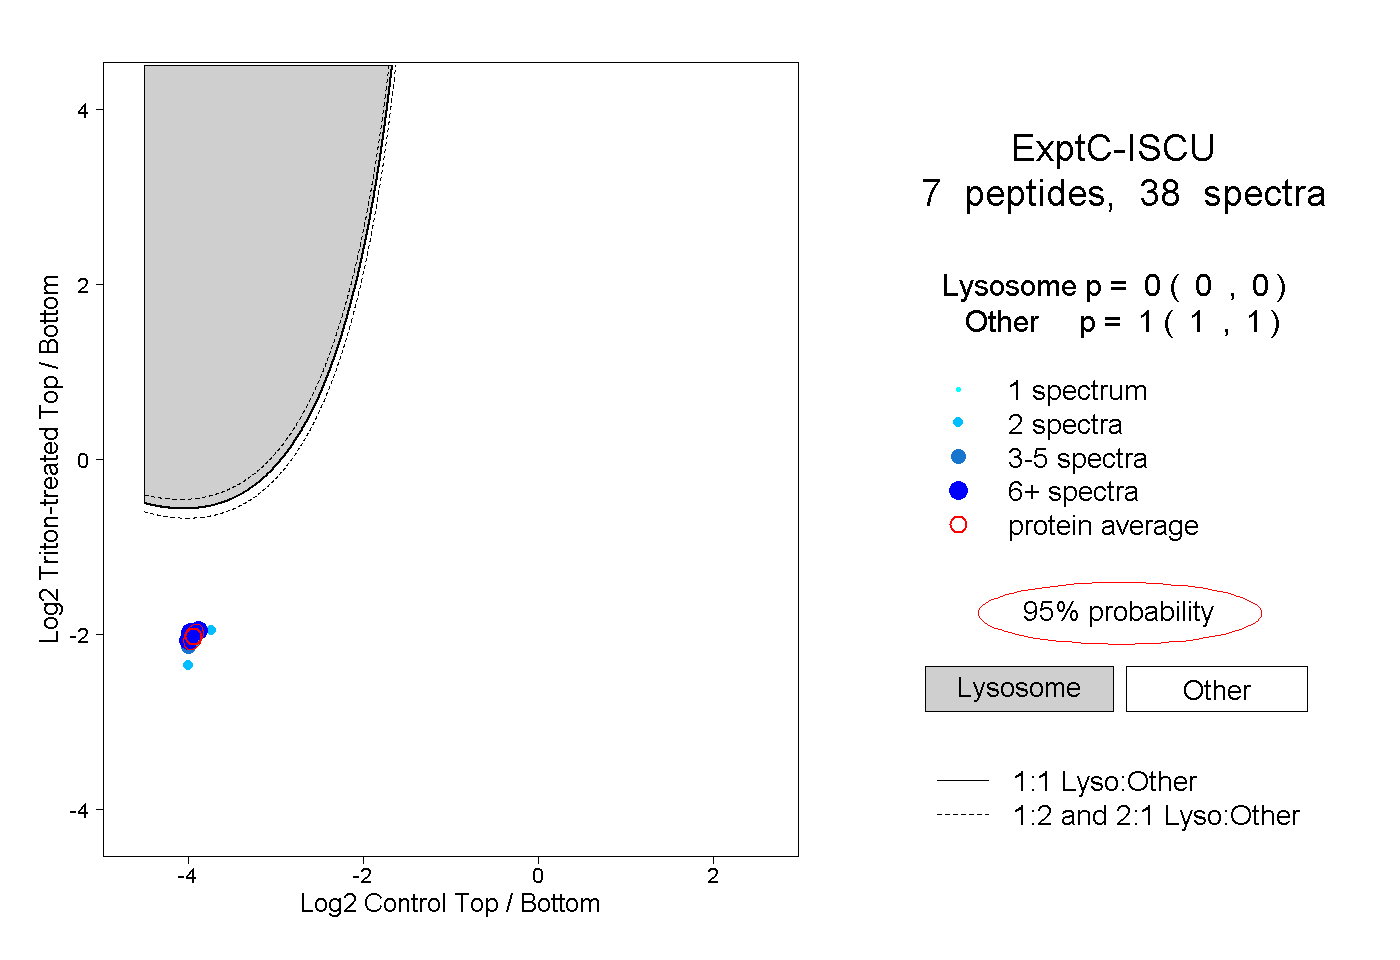 |
0.000 0.000 | 0.000 |
1.000 1.000 | 1.000 |
||||||||
| Plot | Lyso | Other | |||||||||||
| Expt D |
3 peptides |
5 spectra |
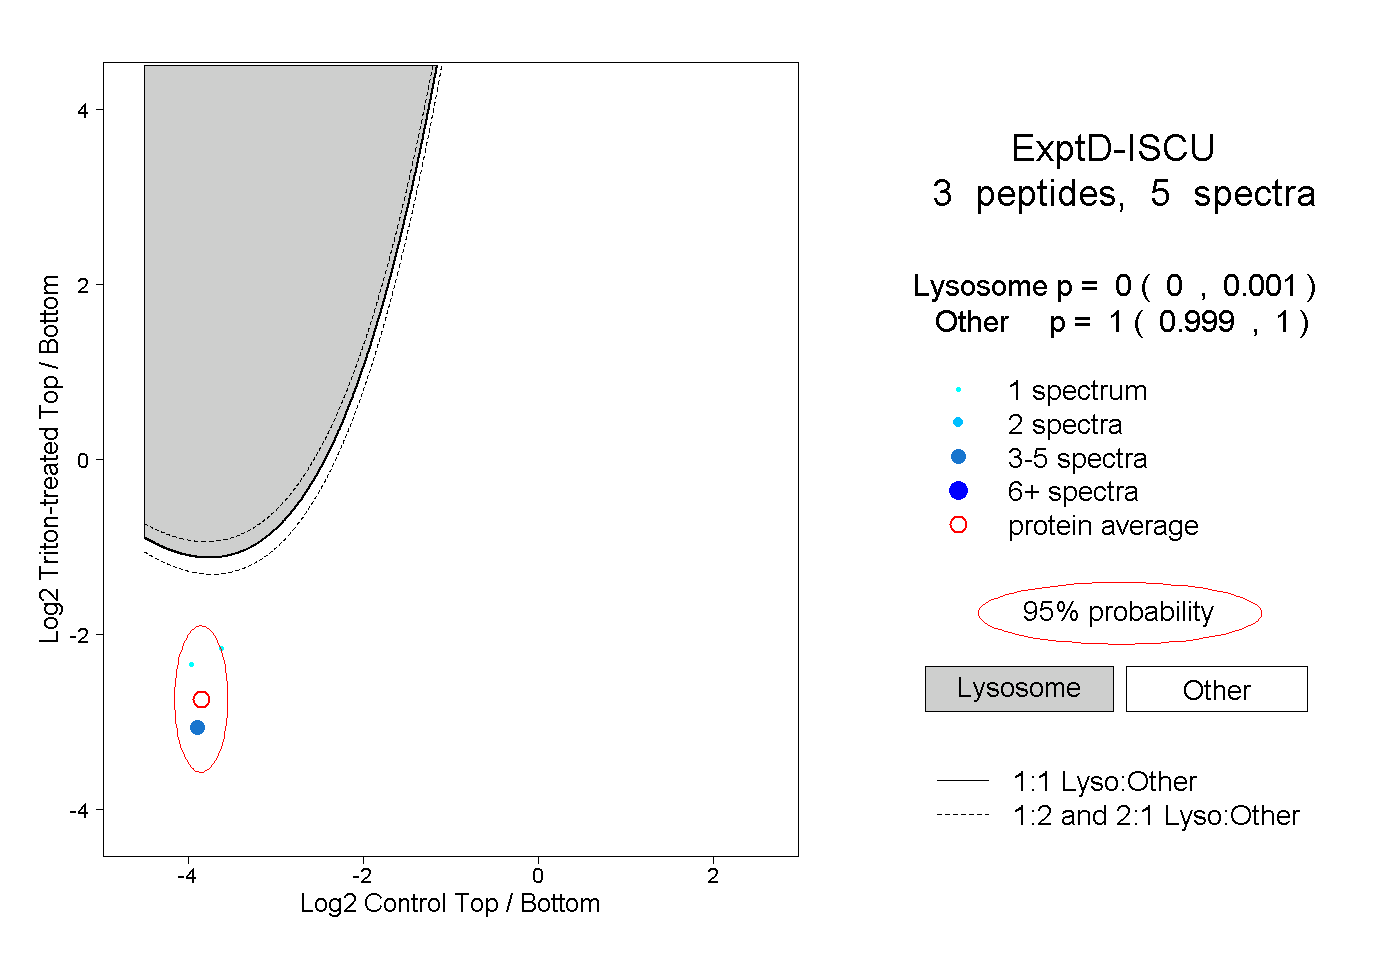 |
0.000 0.000 | 0.001 |
1.000 0.999 | 1.000 |