 5
5peptides
spectra
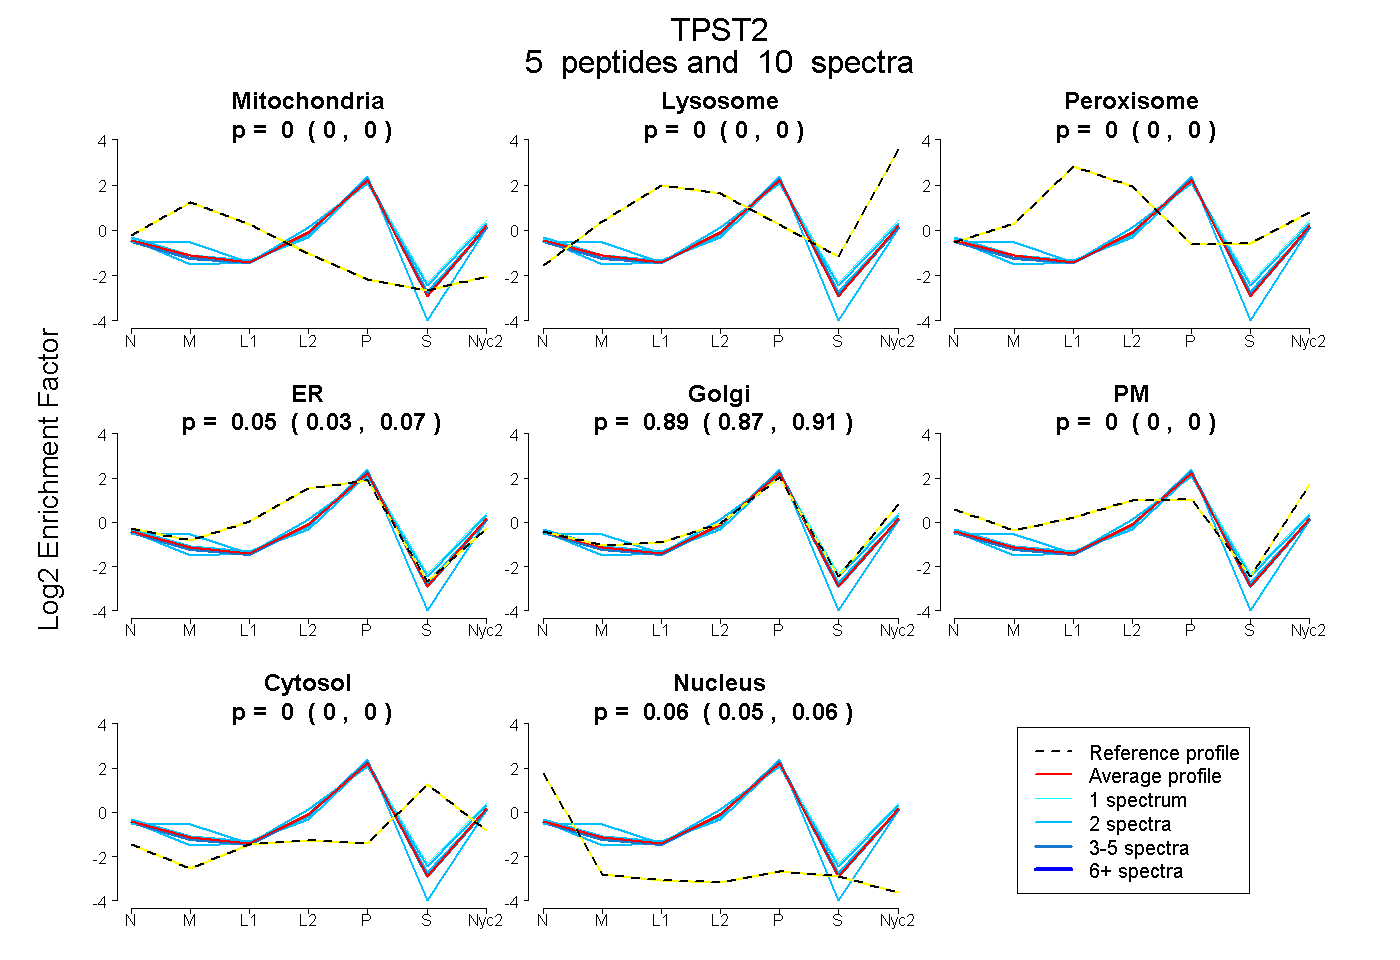
0.000 | 0.000
0.000 | 0.000
0.000 | 0.000
0.029 | 0.066
0.874 | 0.912
0.000 | 0.000
0.000 | 0.000
0.050 | 0.060
1peptide
spectra
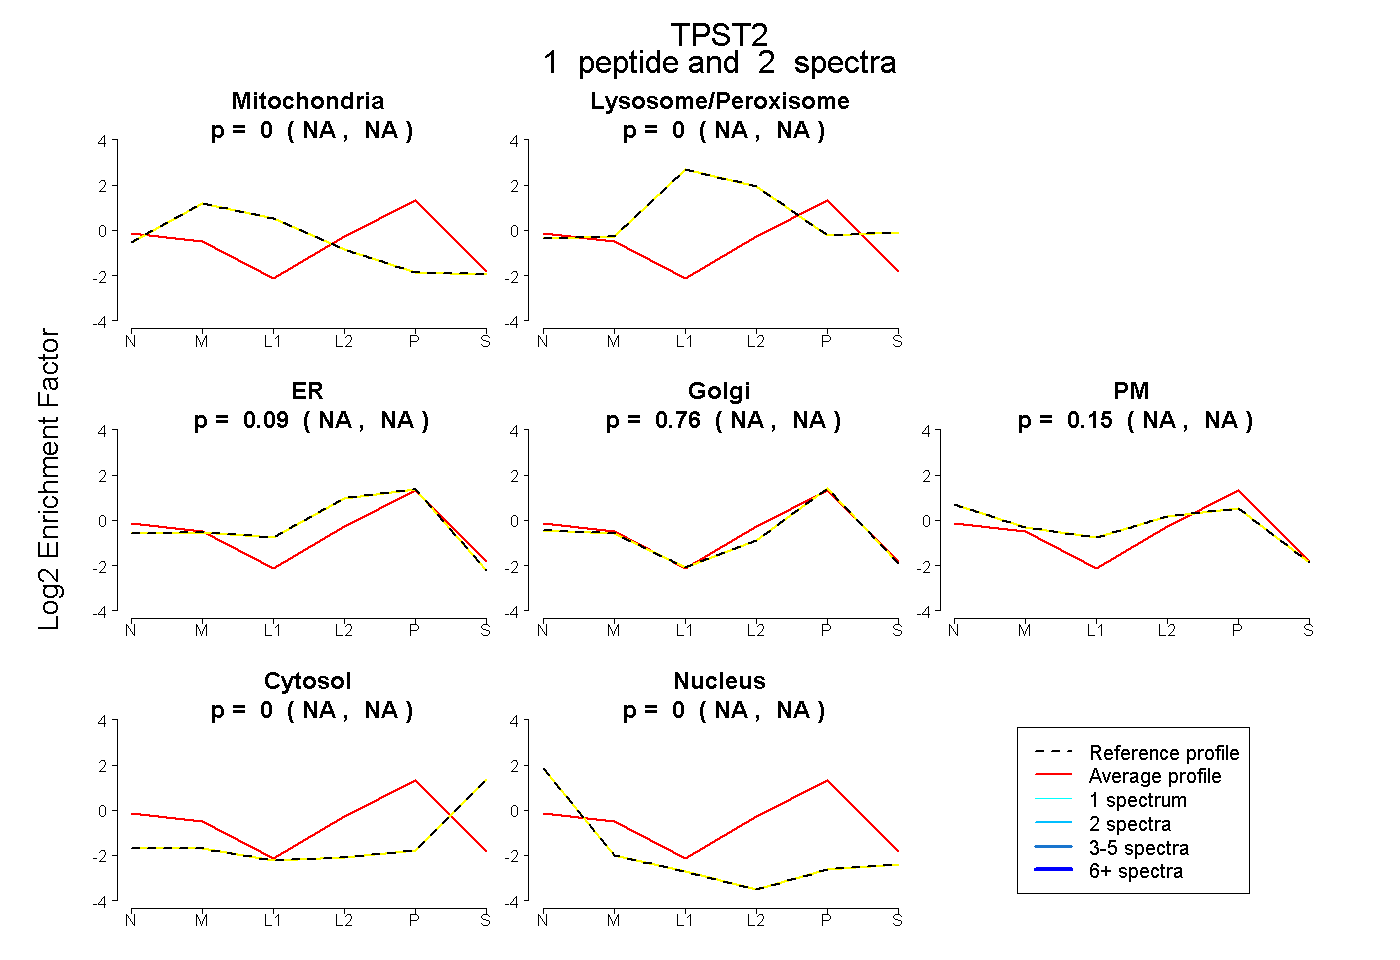
NA | NA
NA | NA
NA | NA
NA | NA
NA | NA
NA | NA
NA | NA
3peptides
spectra
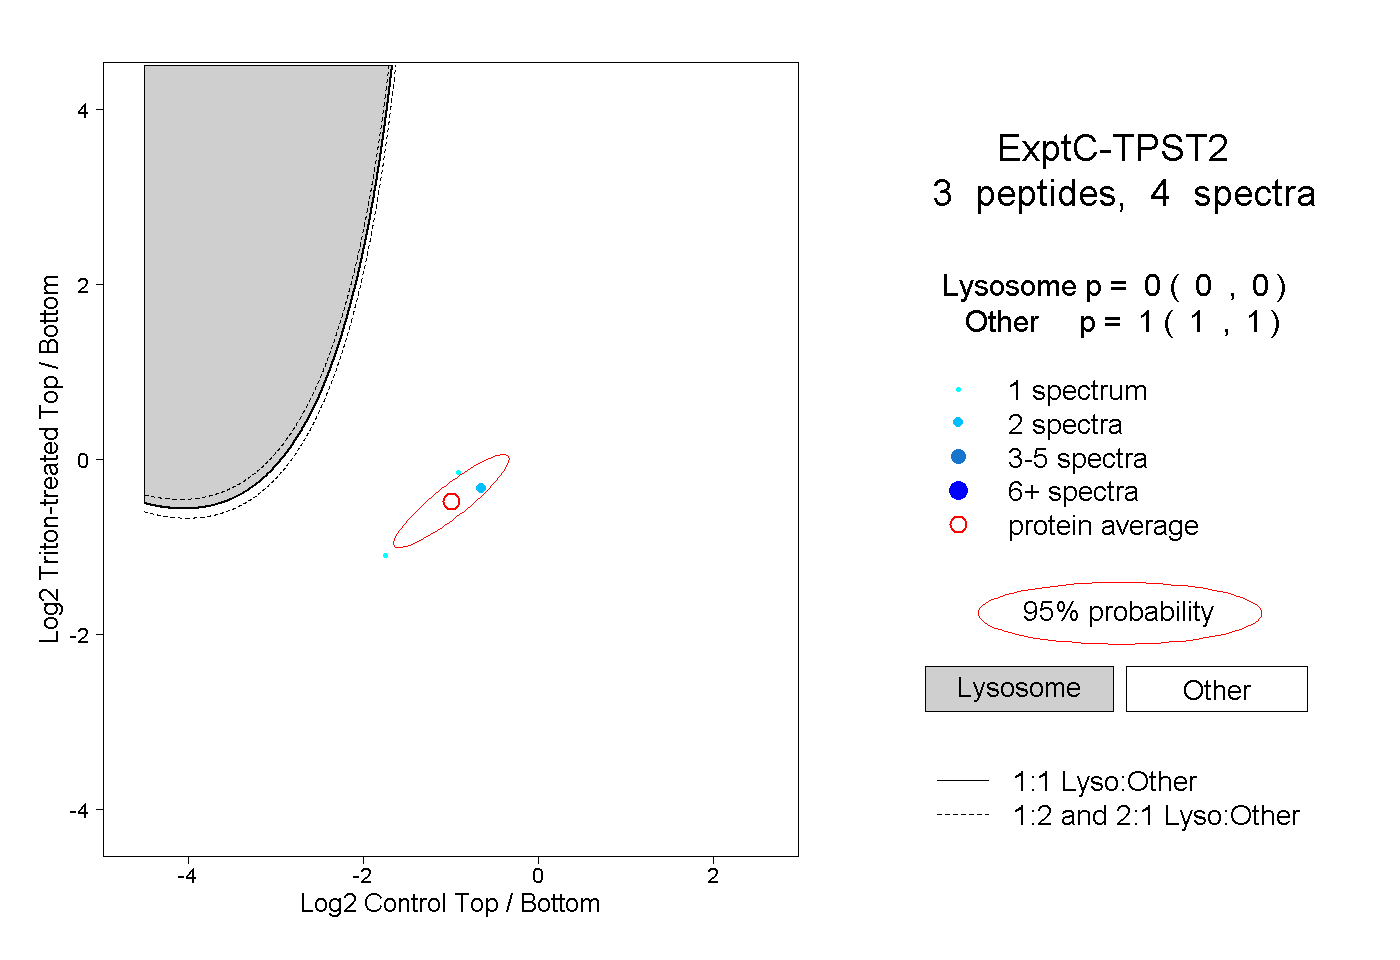
0.000 | 0.000
1.000 | 1.000