 5
5peptides
spectra
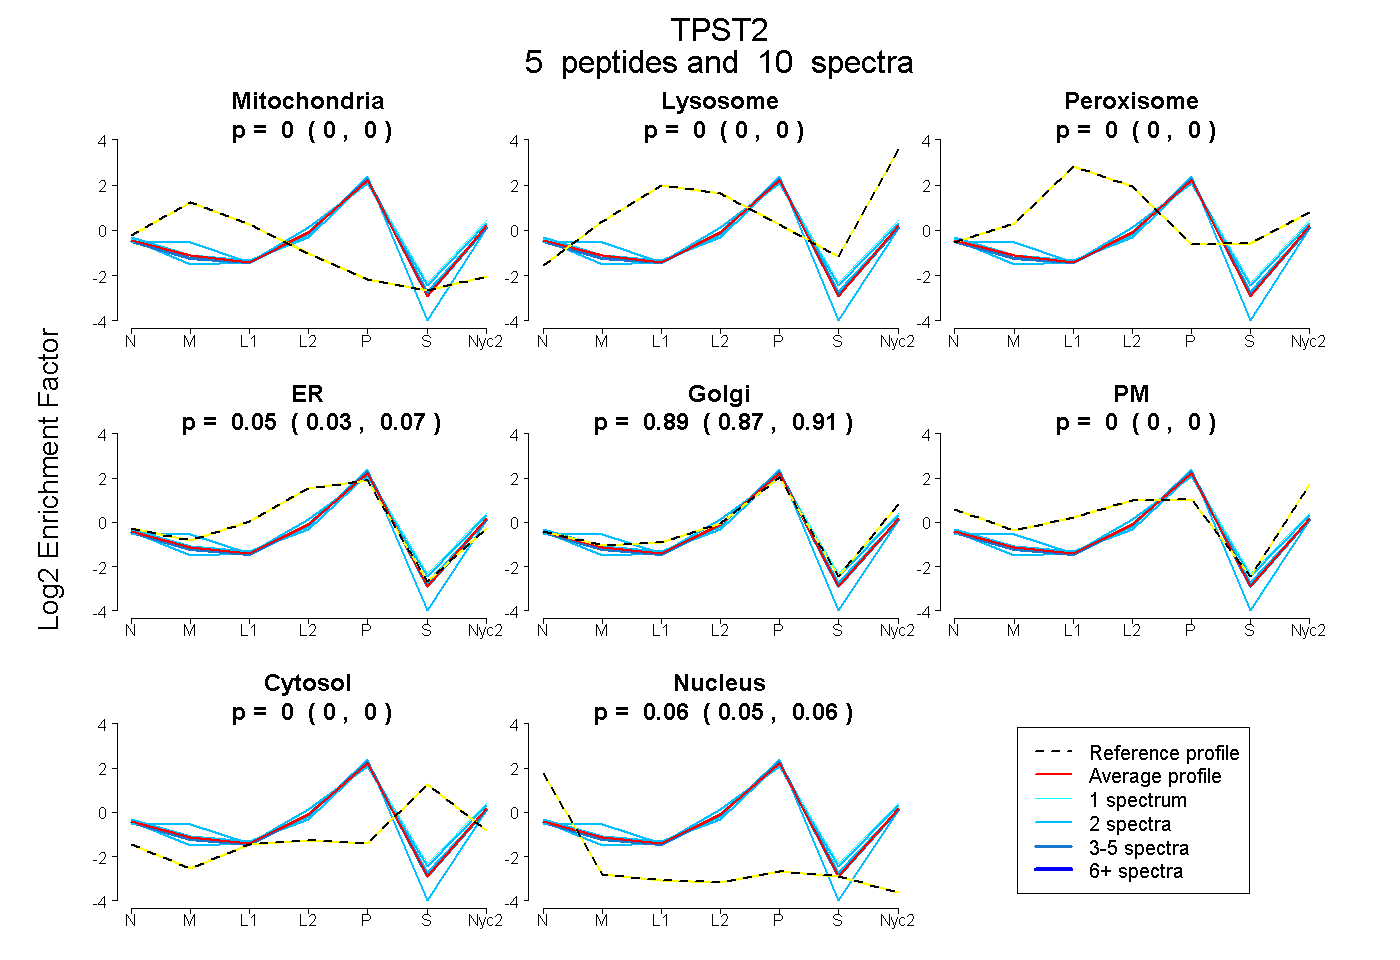
0.000 | 0.000
0.000 | 0.000
0.000 | 0.000
0.029 | 0.066
0.874 | 0.912
0.000 | 0.000
0.000 | 0.000
0.050 | 0.060
| Plot | Mito | Lyso | Perox | ER | Golgi | PM | Cytosol | Nucleus | |||||
| Expt A |
5 peptides |
10 spectra |
|
0.000 0.000 | 0.000 |
0.000 0.000 | 0.000 |
0.000 0.000 | 0.000 |
0.050 0.029 | 0.066 |
0.894 0.874 | 0.912 |
0.000 0.000 | 0.000 |
0.000 0.000 | 0.000 |
0.056 0.050 | 0.060 |
| 2 spectra, WTGHIPR | 0.028 | 0.000 | 0.000 | 0.069 | 0.888 | 0.000 | 0.000 | 0.014 | ||
| 2 spectra, AVLGGVR | 0.000 | 0.000 | 0.000 | 0.088 | 0.839 | 0.000 | 0.000 | 0.073 | ||
| 2 spectra, SSVYLAR | 0.000 | 0.000 | 0.000 | 0.015 | 0.917 | 0.000 | 0.000 | 0.068 | ||
| 1 spectrum, LFPNSK | 0.000 | 0.000 | 0.000 | 0.000 | 0.958 | 0.000 | 0.000 | 0.042 | ||
| 3 spectra, TMPLIFVGGVPR | 0.000 | 0.000 | 0.000 | 0.050 | 0.891 | 0.000 | 0.000 | 0.059 |
| Plot | Mito | Lyso or Perox | ER | Golgi | PM | Cytosol | Nucleus | ||||||
| Expt B |
1 peptide |
2 spectra |
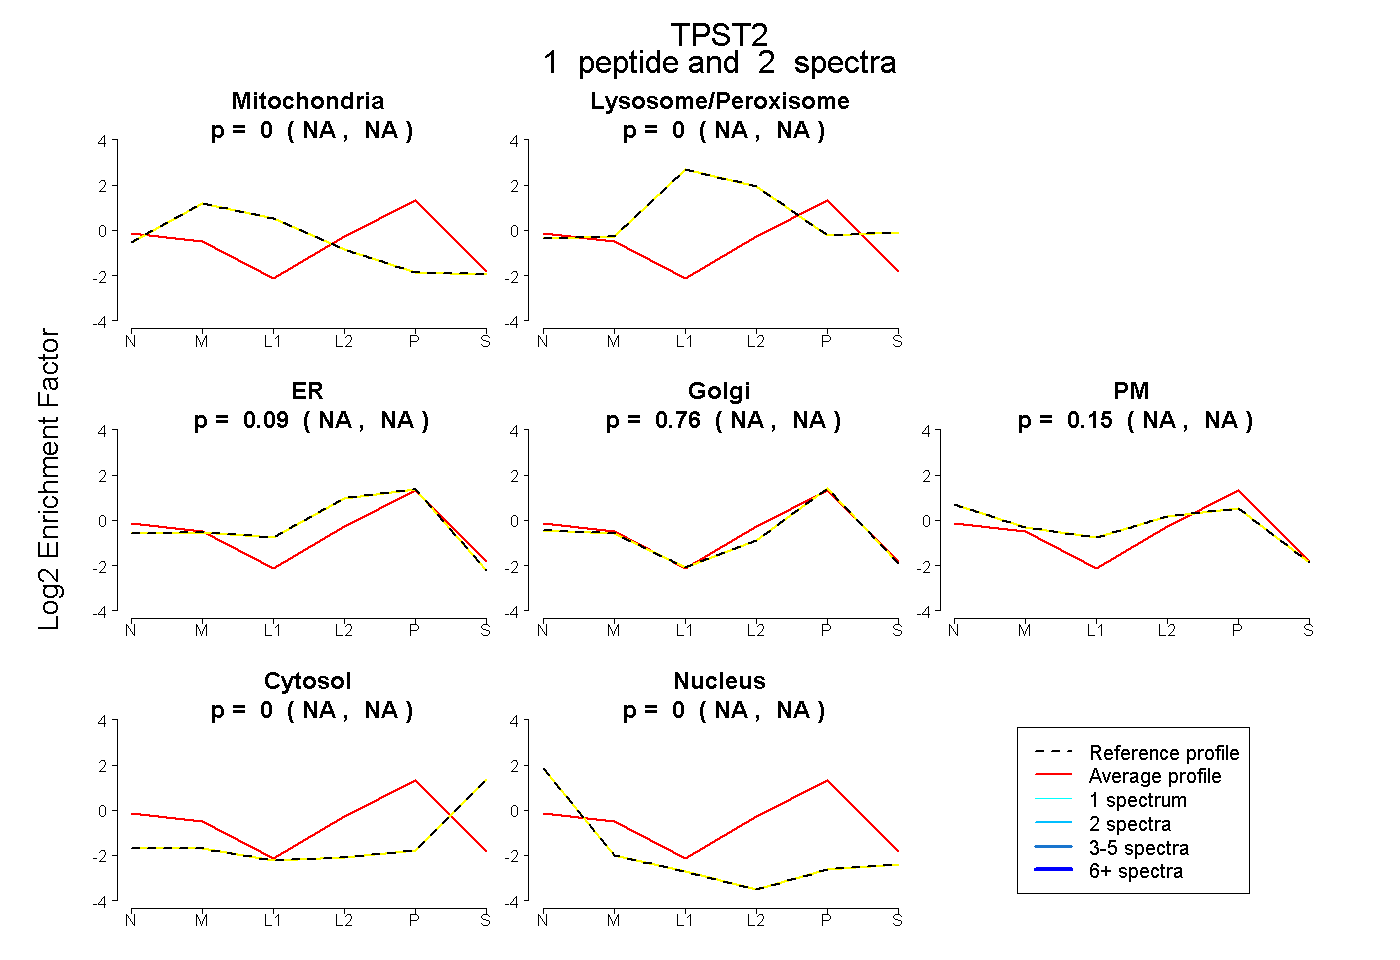 |
0.000 NA | NA |
0.000 NA | NA |
0.090 NA | NA |
0.759 NA | NA |
0.151 NA | NA |
0.000 NA | NA |
0.000 NA | NA |
|||
| Plot | Lyso | Other | |||||||||||
| Expt C |
3 peptides |
4 spectra |
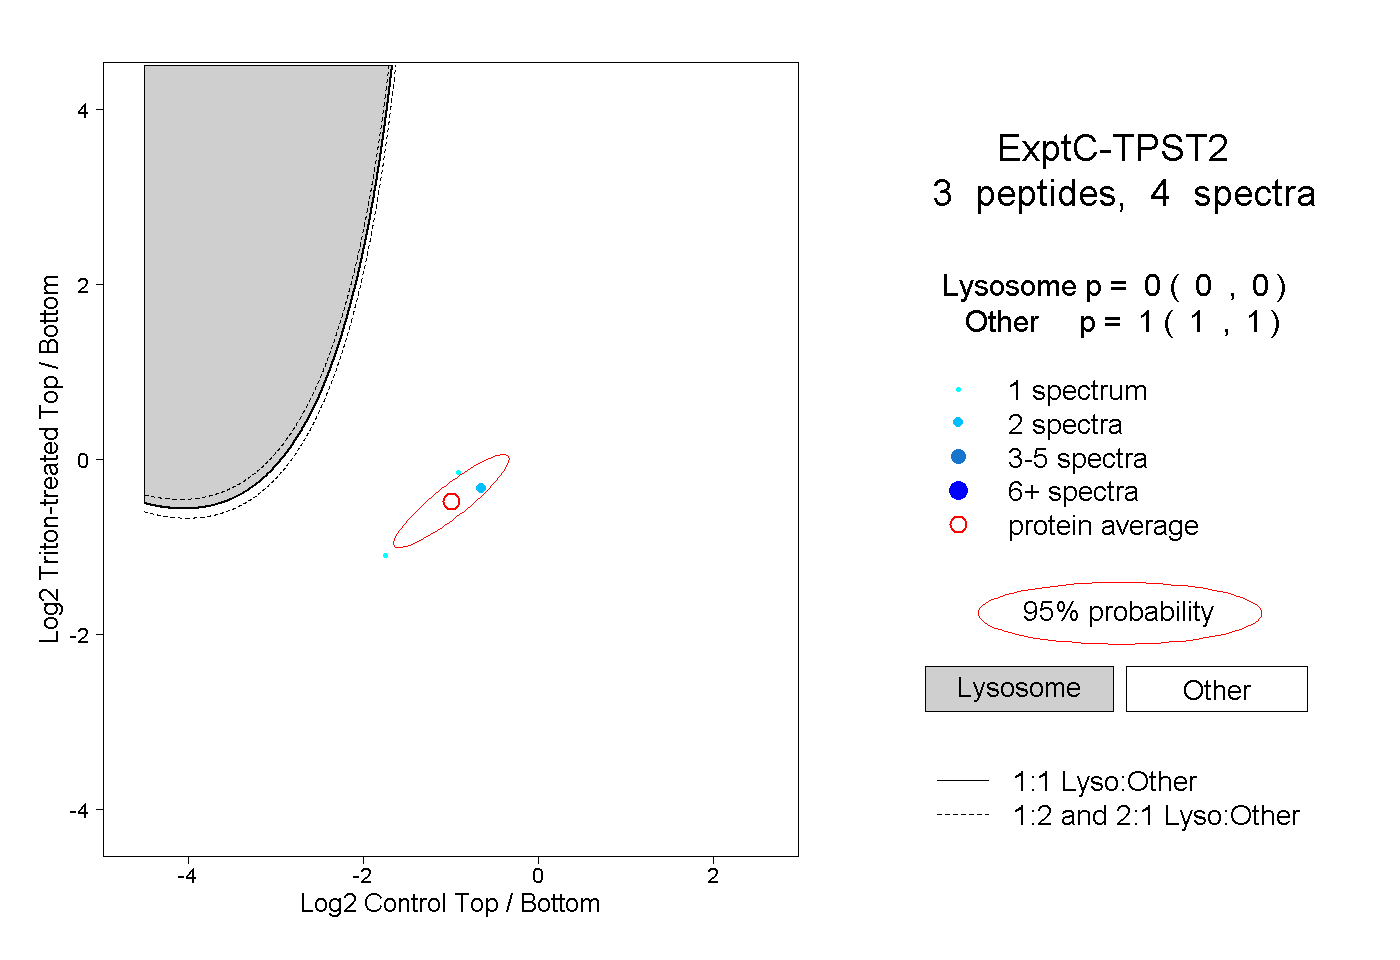 |
0.000 0.000 | 0.000 |
1.000 1.000 | 1.000 |