 8
8peptides
spectra
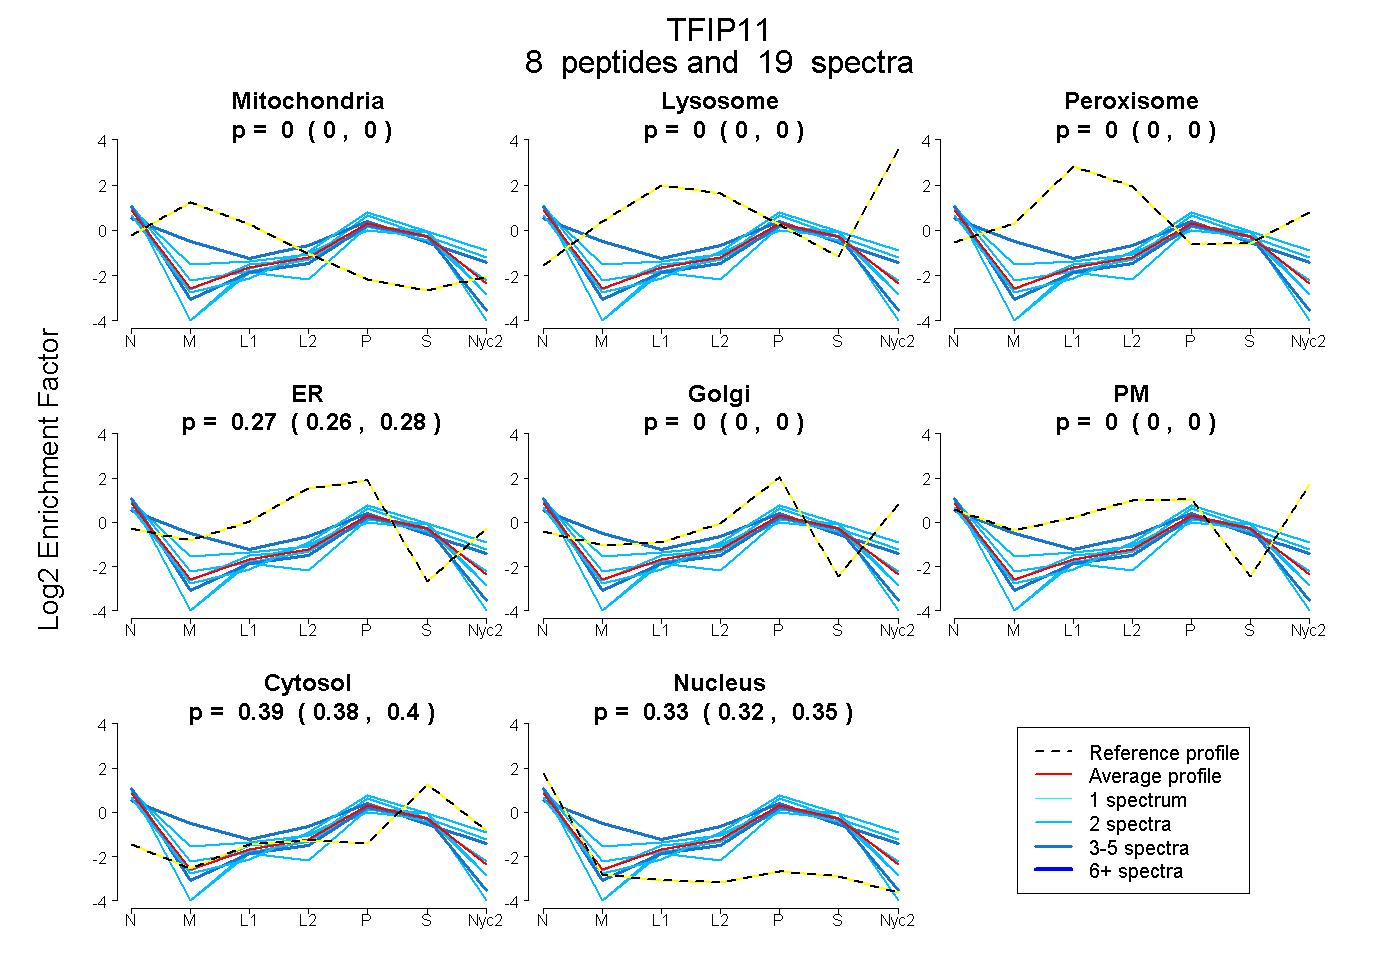
0.000 | 0.000
0.000 | 0.000
0.000 | 0.000
0.259 | 0.283
0.000 | 0.000
0.000 | 0.000
0.381 | 0.403
0.320 | 0.346
3peptides
spectra
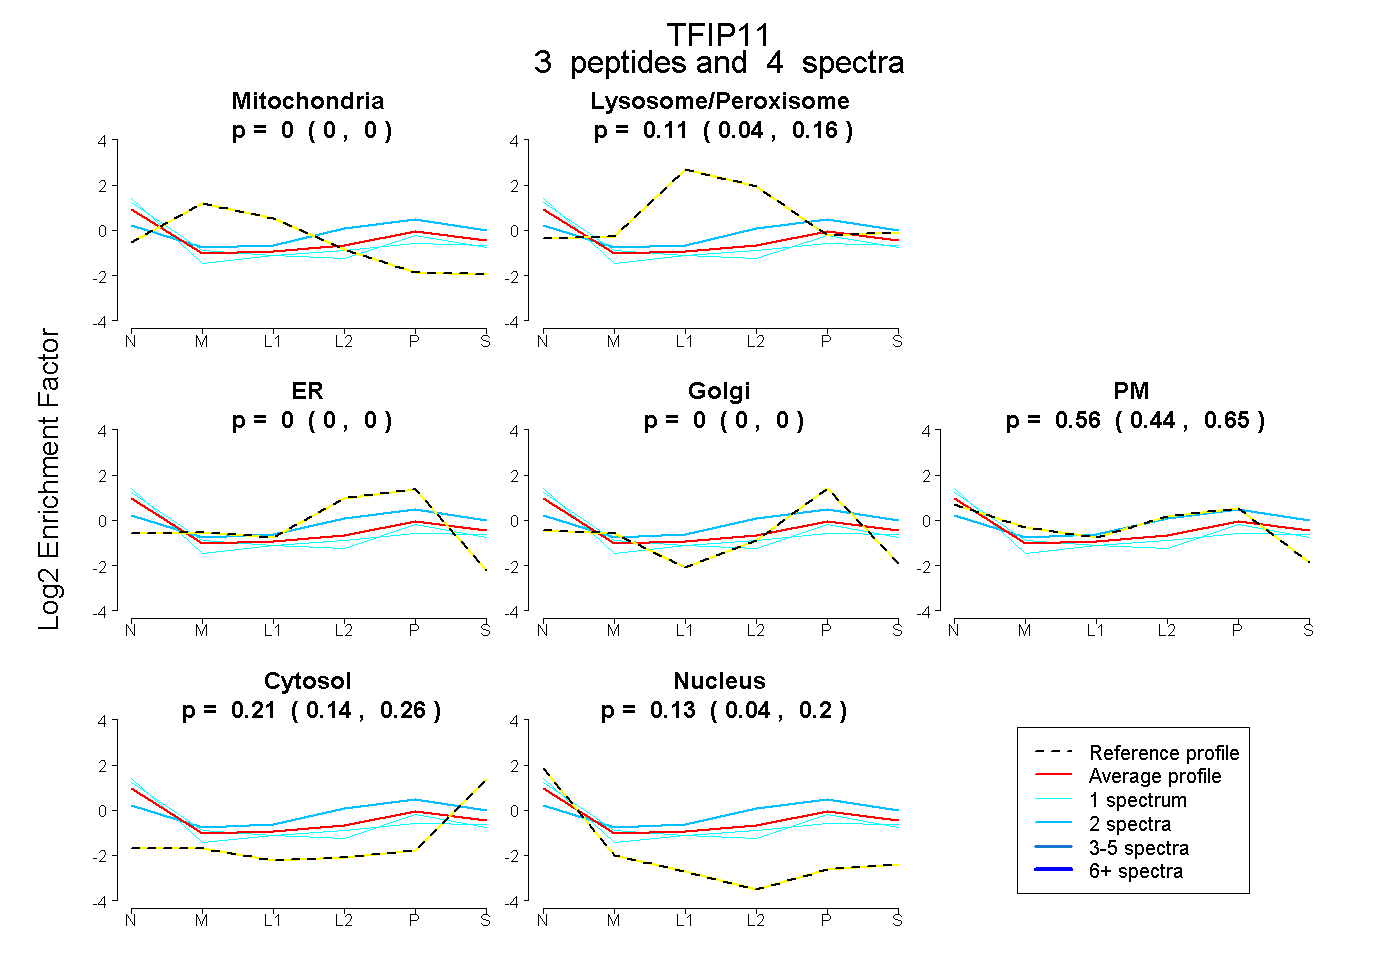
0.000 | 0.000
0.044 | 0.162
0.000 | 0.000
0.000 | 0.000
0.436 | 0.653
0.142 | 0.264
0.044 | 0.201
4peptides
spectra
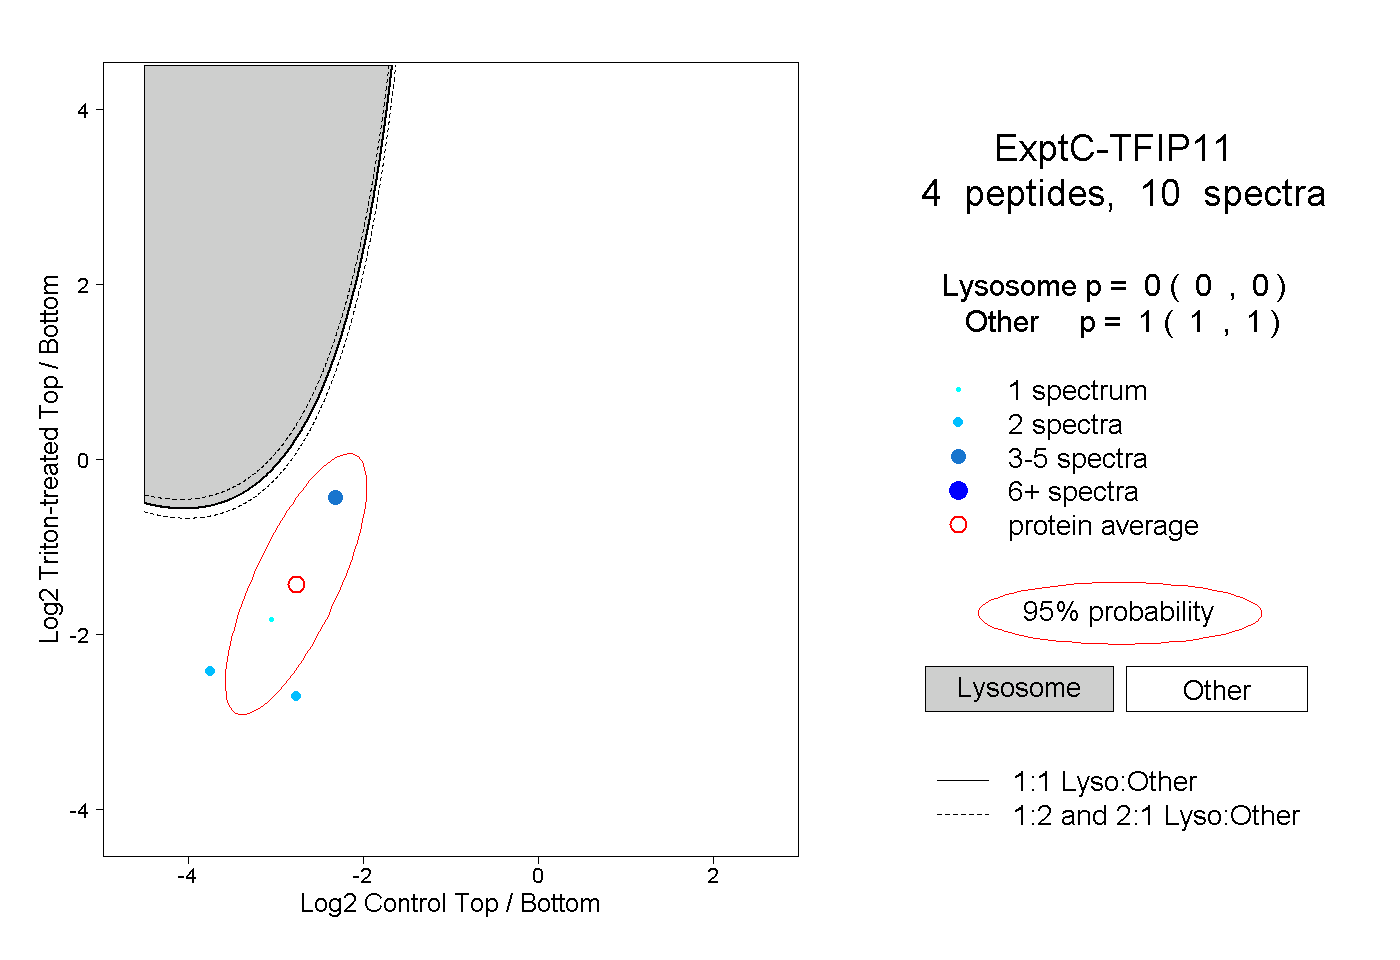
0.000 | 0.000
1.000 | 1.000