TFIP11
[ENSRNOP00000000828]
Main page
| | | Plot |
Mito |
Lyso |
|
Perox |
ER |
Golgi |
PM |
Cytosol |
Nucleus |
|
| Expt A |
 8
8
peptides |
19
spectra |
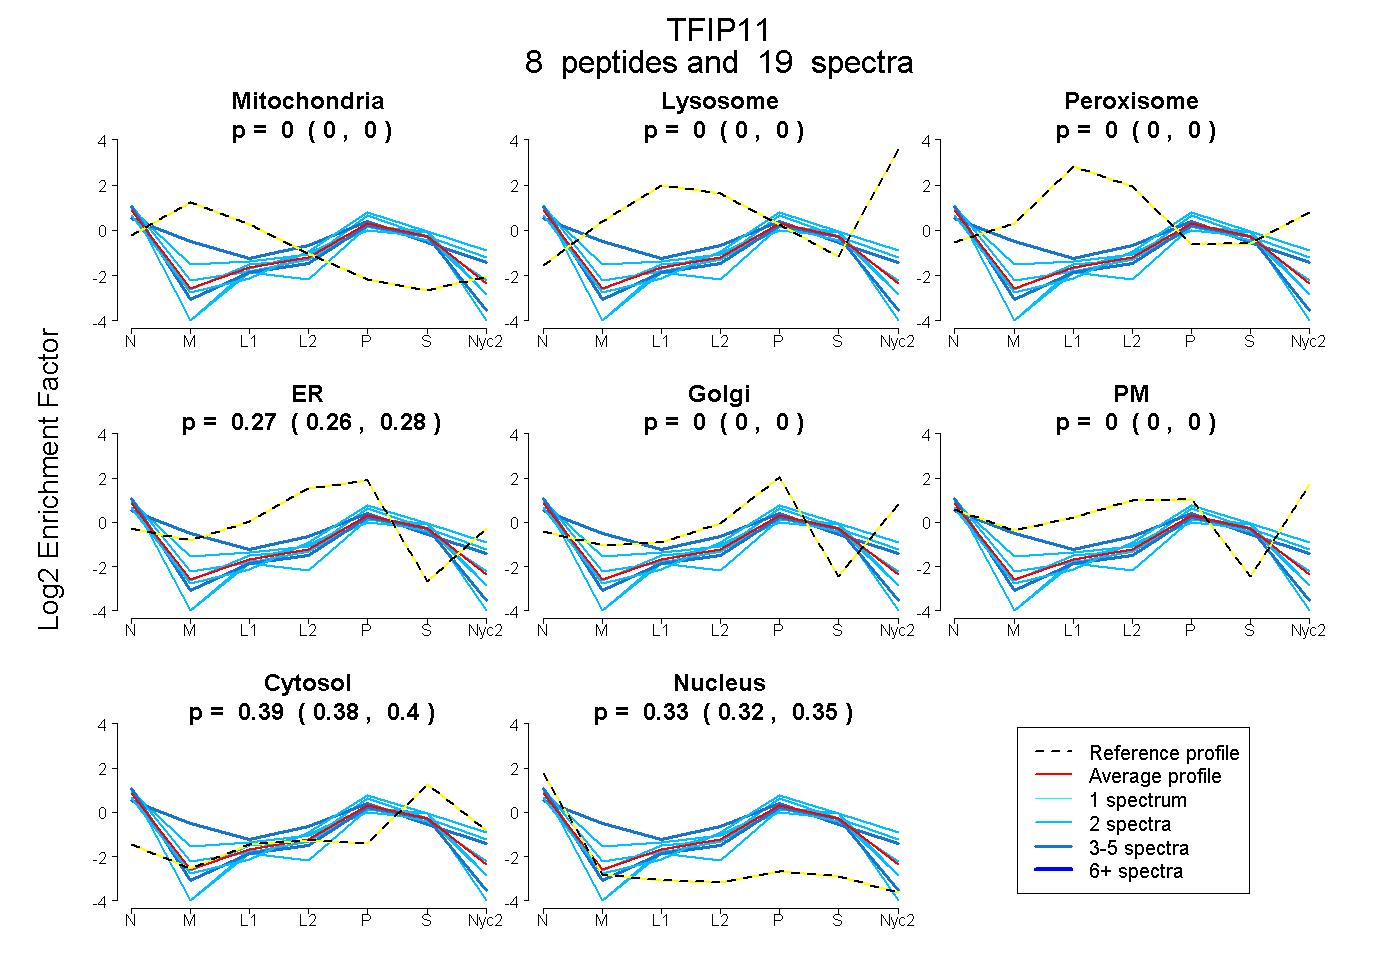 |
0.000
0.000 | 0.000 |
0.000
0.000 | 0.000 |
|
0.000
0.000 | 0.000 |
0.272
0.259 | 0.283 |
0.000
0.000 | 0.000 |
0.000
0.000 | 0.000 |
0.393
0.381 | 0.403 |
0.335
0.320 | 0.346 |
|
| | | Plot |
Mito |
|
Lyso or Perox |
|
ER |
Golgi |
PM |
Cytosol |
Nucleus |
|
| Expt B |
3
peptides |
4
spectra |
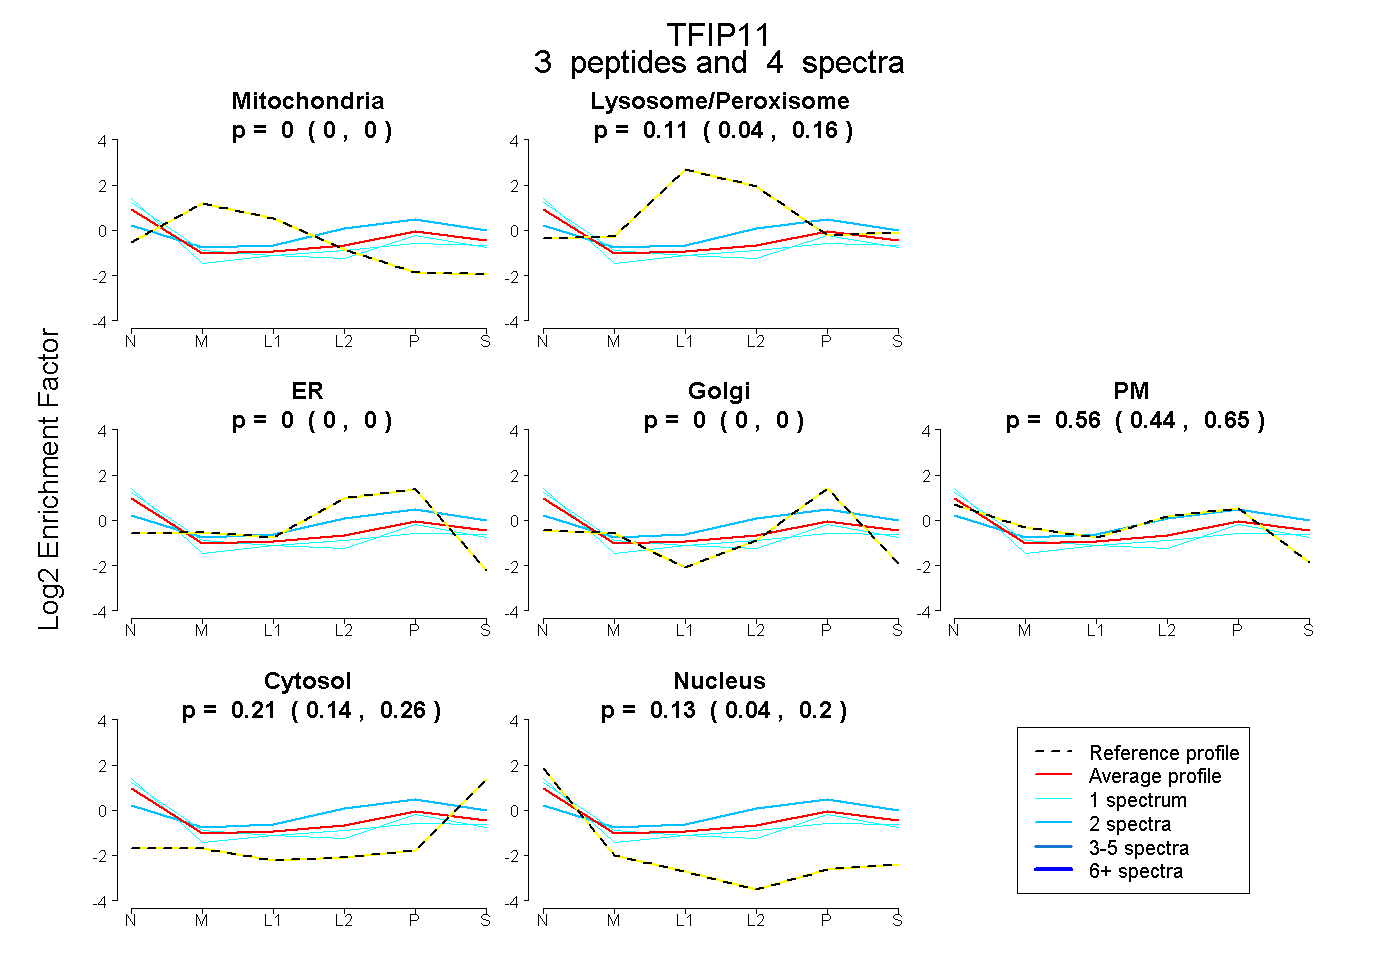 |
0.000
0.000 | 0.000 |
|
0.107
0.044 | 0.162 |
|
0.000
0.000 | 0.000 |
0.000
0.000 | 0.000 |
0.559
0.436 | 0.653 |
0.205
0.142 | 0.264 |
0.129
0.044 | 0.201 |
|
| 2 spectra, FNEALDIMNR |
0.000 |
|
0.241 |
|
0.000 |
0.143 |
0.384 |
0.231 |
0.000 |
|
| 1 spectrum, LEPLYSPVR |
0.000 |
|
0.066 |
|
0.000 |
0.000 |
0.545 |
0.148 |
0.241 |
|
| 1 spectrum, TAEVLAHEER |
0.000 |
|
0.162 |
|
0.000 |
0.000 |
0.389 |
0.126 |
0.323 |
|
| | | Plot |
|
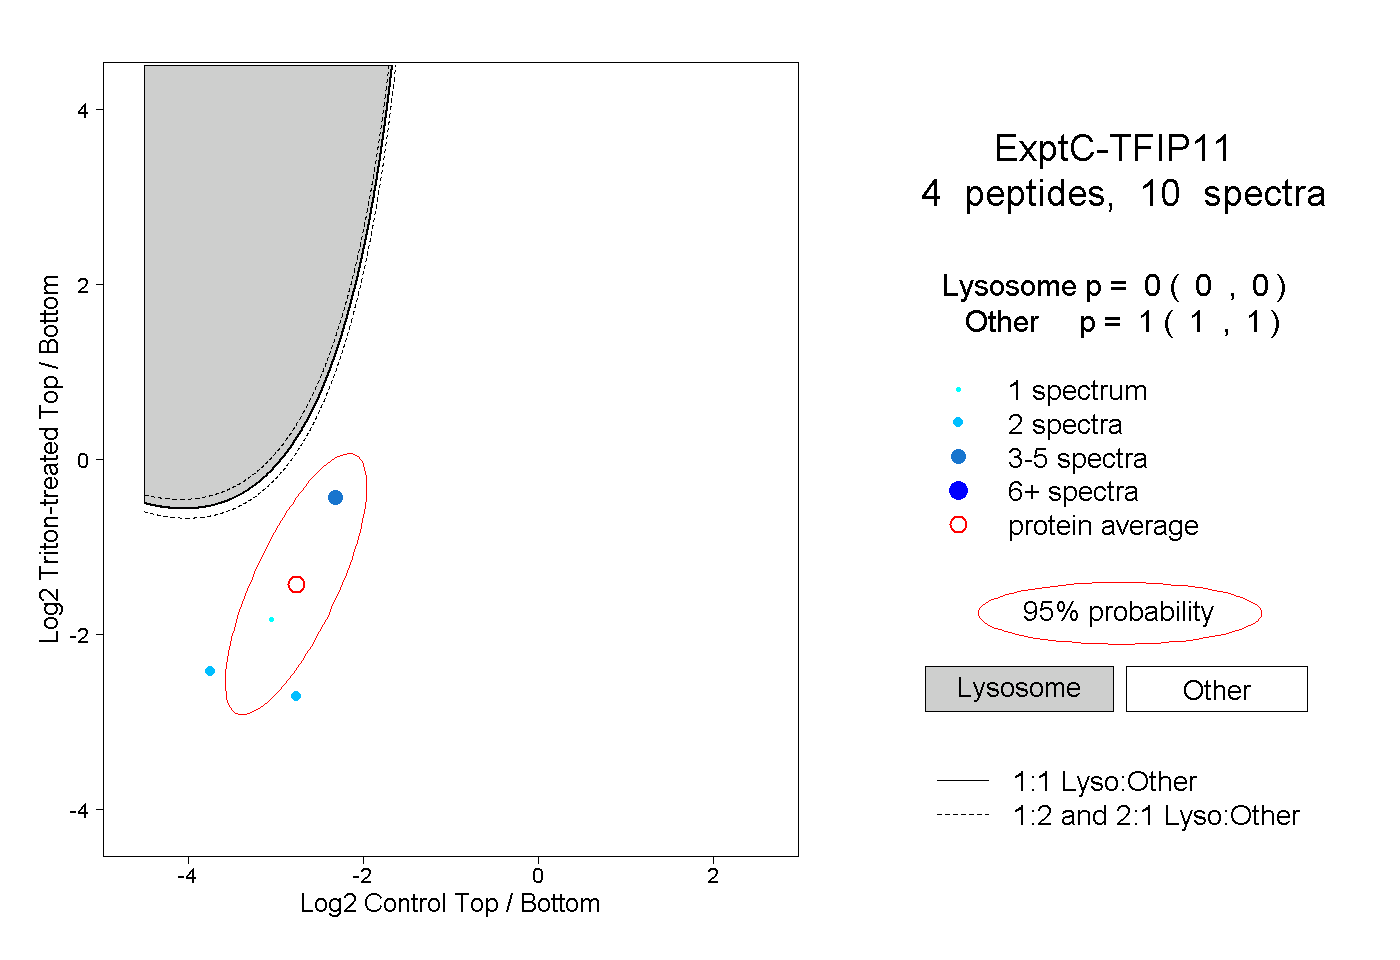
Lyso |
|
|
|
|
|
|
|
Other |
| Expt C |
4
peptides |
10
spectra |
 |
|
0.000
0.000 | 0.000 |
|
|
|
|
|
|
|
1.000
1.000 | 1.000 |