 4
4peptides
spectra
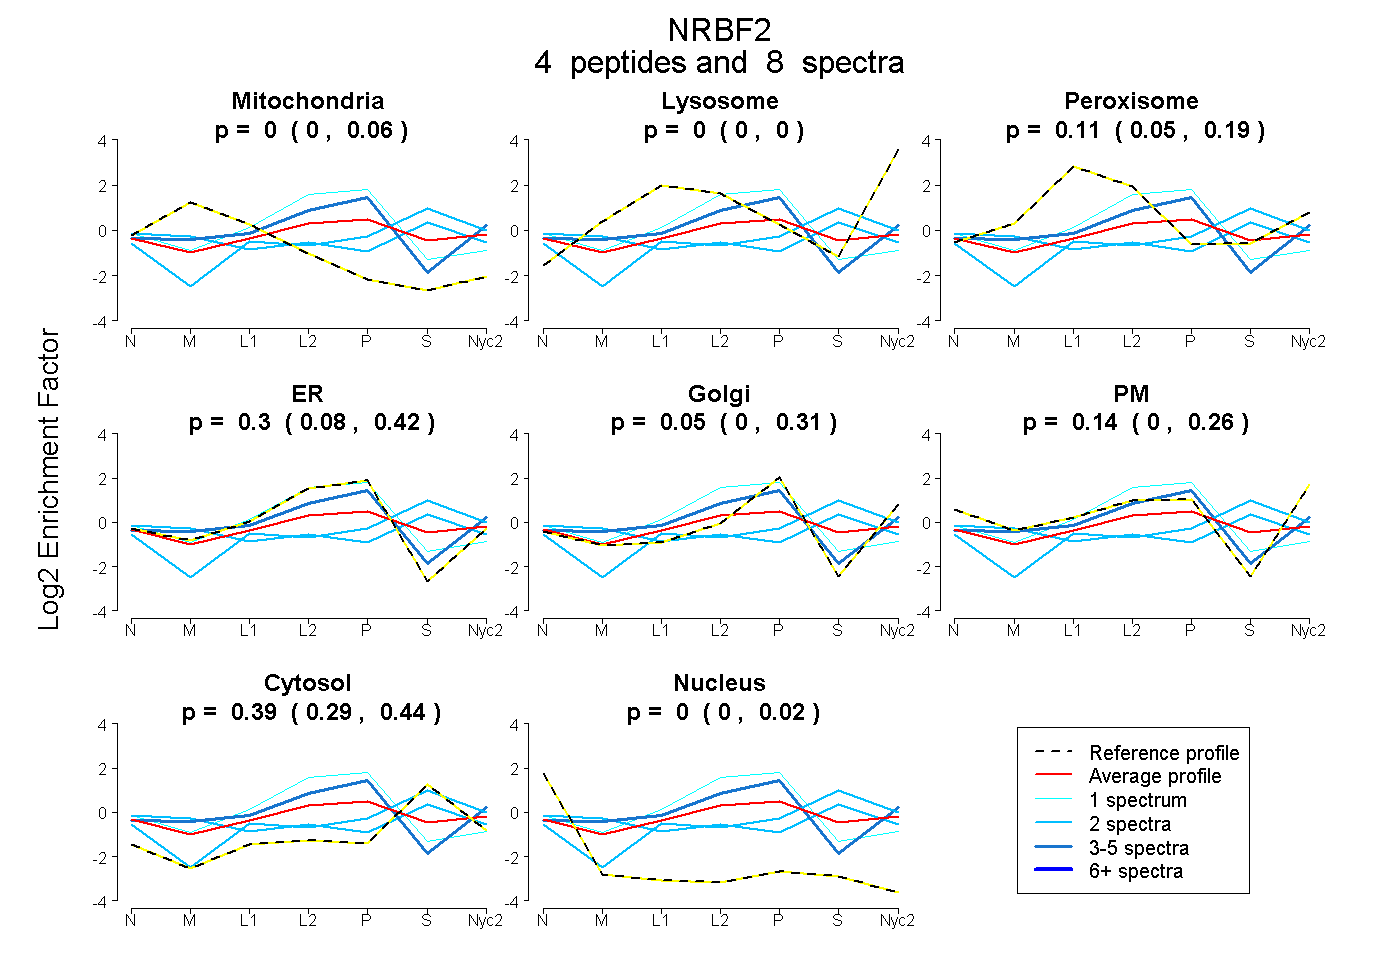
0.000 | 0.061
0.000 | 0.000
0.047 | 0.193
0.078 | 0.420
0.000 | 0.314
0.000 | 0.261
0.290 | 0.438
0.000 | 0.018
1peptide
spectra
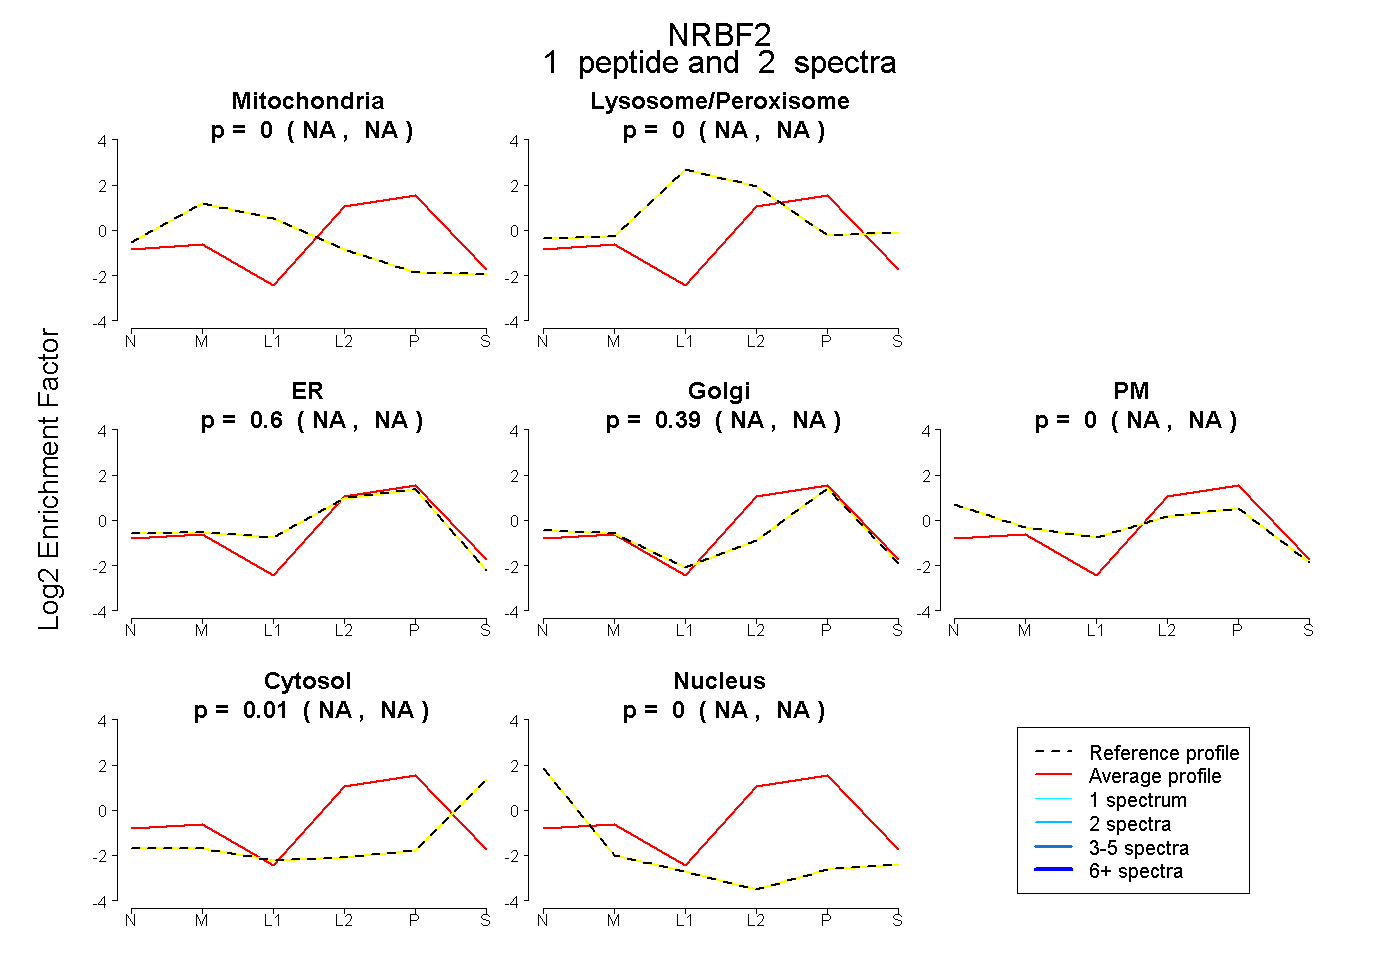
NA | NA
NA | NA
NA | NA
NA | NA
NA | NA
NA | NA
NA | NA
2peptides
spectra
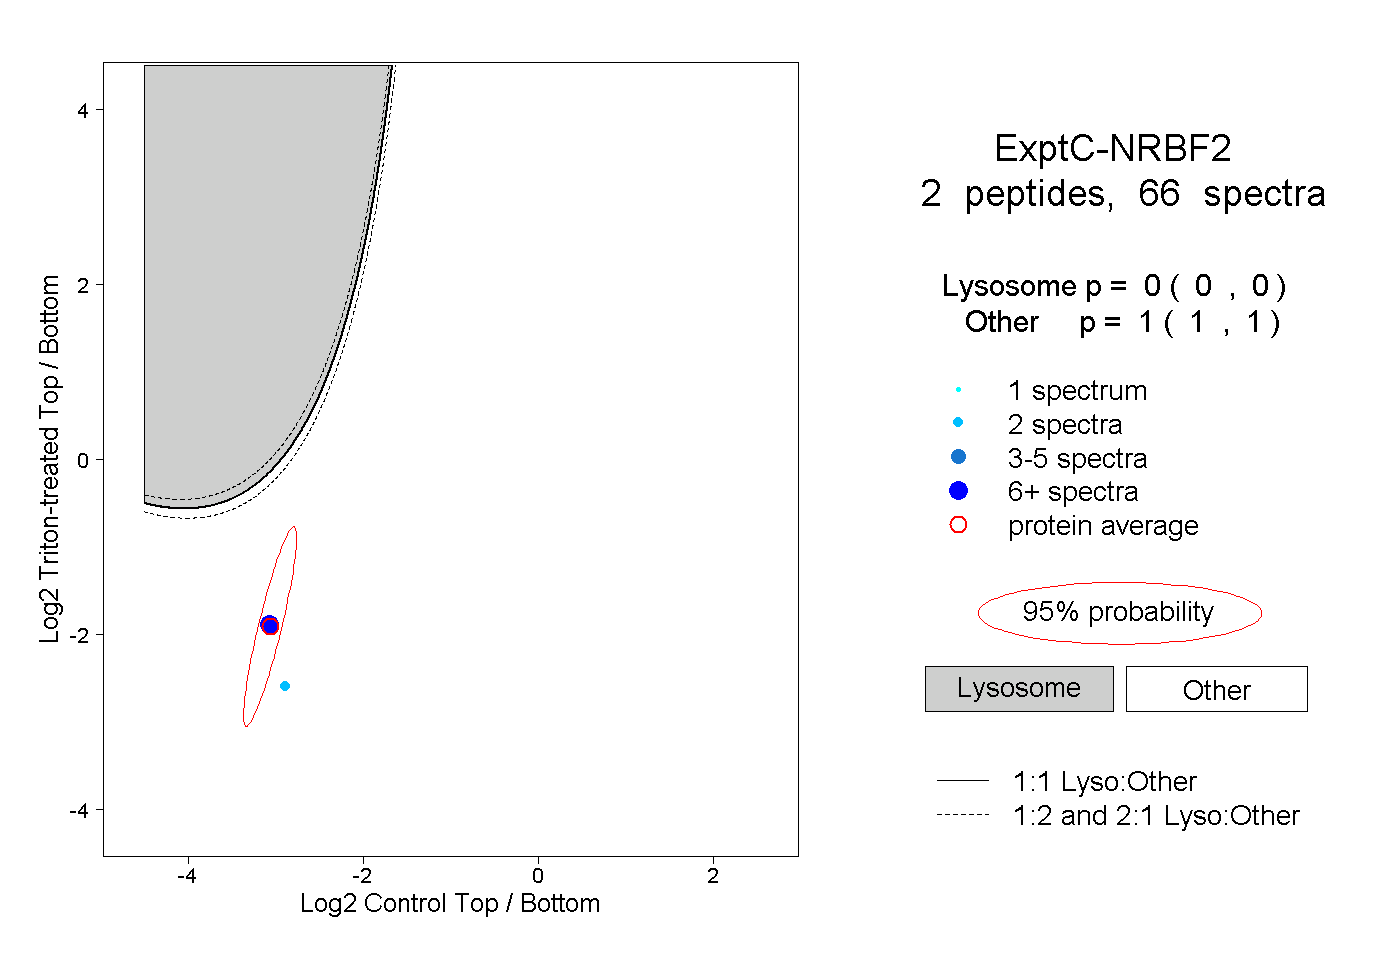
0.000 | 0.000
1.000 | 1.000
1peptide
spectra
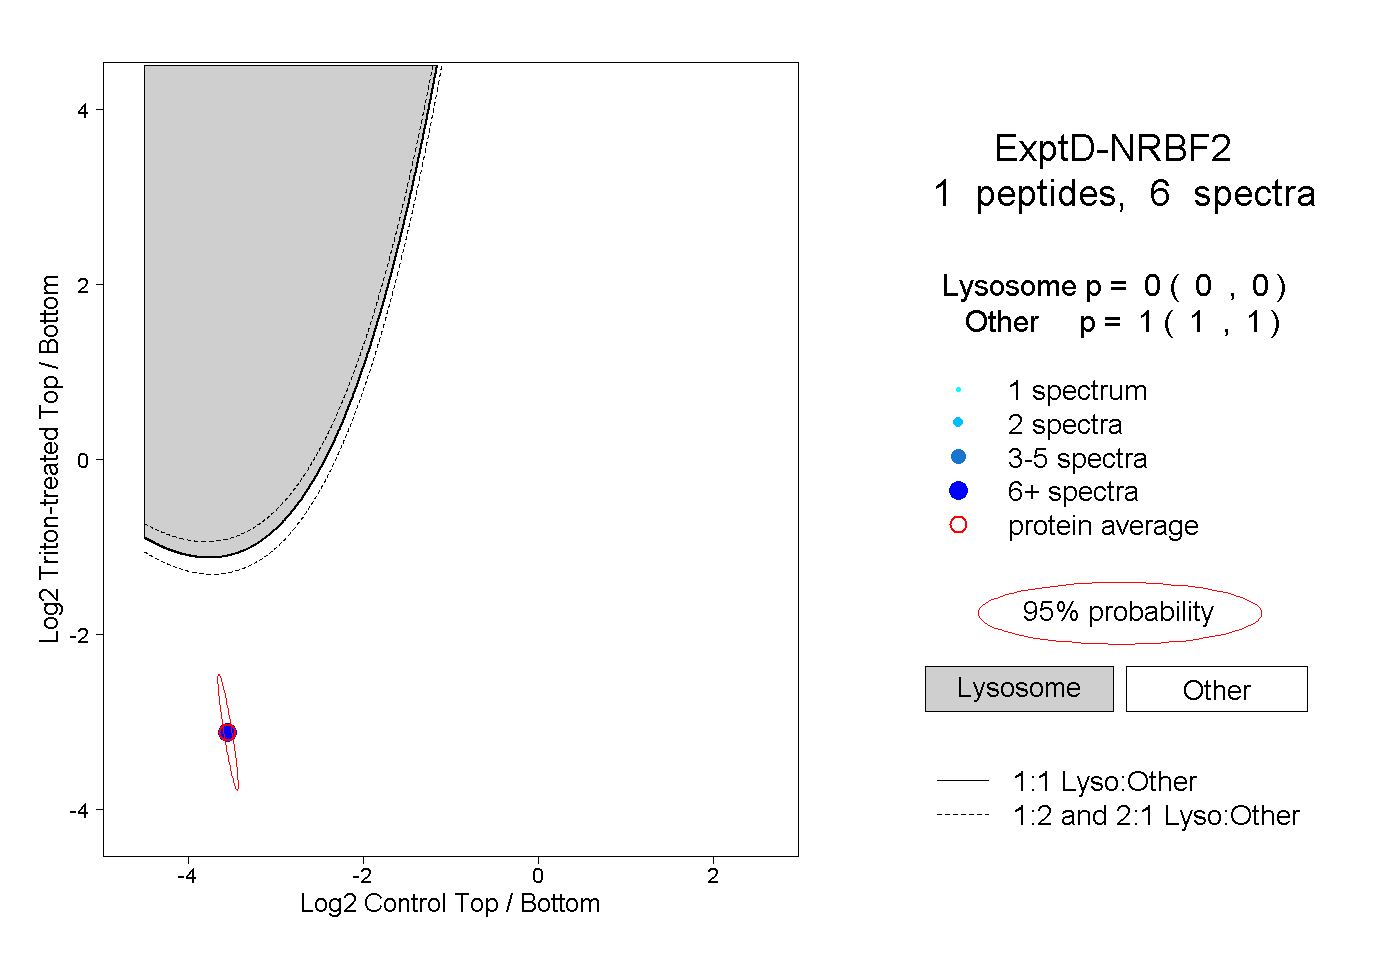
0.000 | 0.000
1.000 | 1.000