 4
4peptides
spectra
0.000 | 0.061
0.000 | 0.000
0.047 | 0.193
0.078 | 0.420
0.000 | 0.314
0.000 | 0.261
0.290 | 0.438
0.000 | 0.018
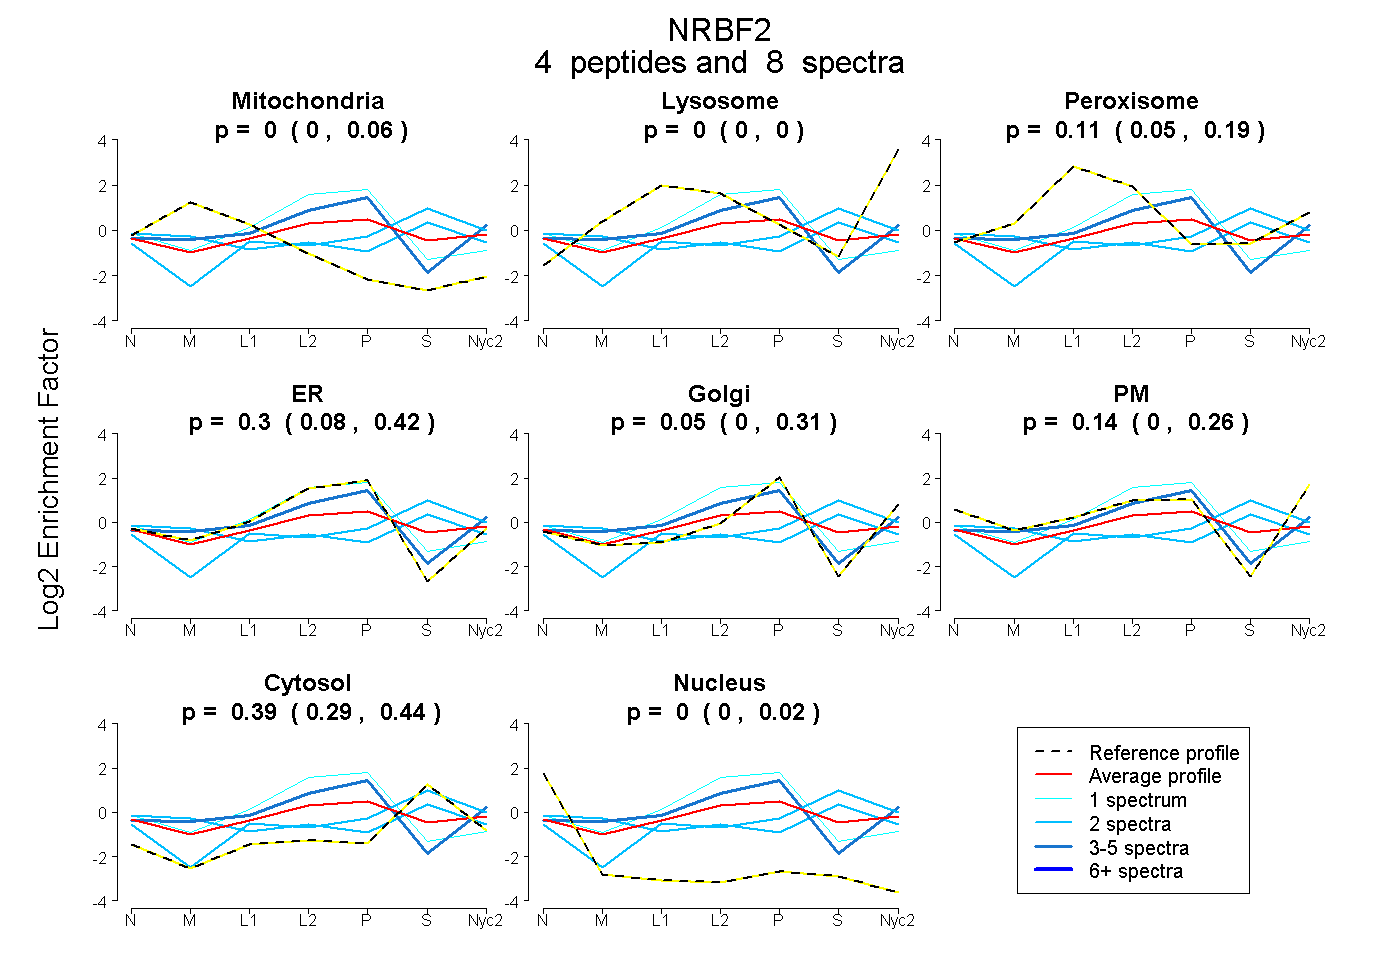
| Plot | Mito | Lyso | Perox | ER | Golgi | PM | Cytosol | Nucleus | |||||
| Expt A |
4 peptides |
8 spectra |
|
0.000 0.000 | 0.061 |
0.000 0.000 | 0.000 |
0.113 0.047 | 0.193 |
0.304 0.078 | 0.420 |
0.053 0.000 | 0.314 |
0.139 0.000 | 0.261 |
0.392 0.290 | 0.438 |
0.000 0.000 | 0.018 |
| 2 spectra, NEPSEPCIGSK | 0.000 | 0.004 | 0.056 | 0.000 | 0.000 | 0.198 | 0.742 | 0.000 | ||
| 1 spectrum, EVMEGPLNLAHQQSR | 0.000 | 0.000 | 0.068 | 0.805 | 0.000 | 0.000 | 0.127 | 0.000 | ||
| 3 spectra, LLAAGK | 0.031 | 0.000 | 0.156 | 0.379 | 0.396 | 0.000 | 0.038 | 0.000 | ||
| 2 spectra, HVEFLVAENER | 0.229 | 0.000 | 0.078 | 0.000 | 0.000 | 0.170 | 0.523 | 0.000 |
| Plot | Mito | Lyso or Perox | ER | Golgi | PM | Cytosol | Nucleus | ||||||
| Expt B |
1 peptide |
2 spectra |
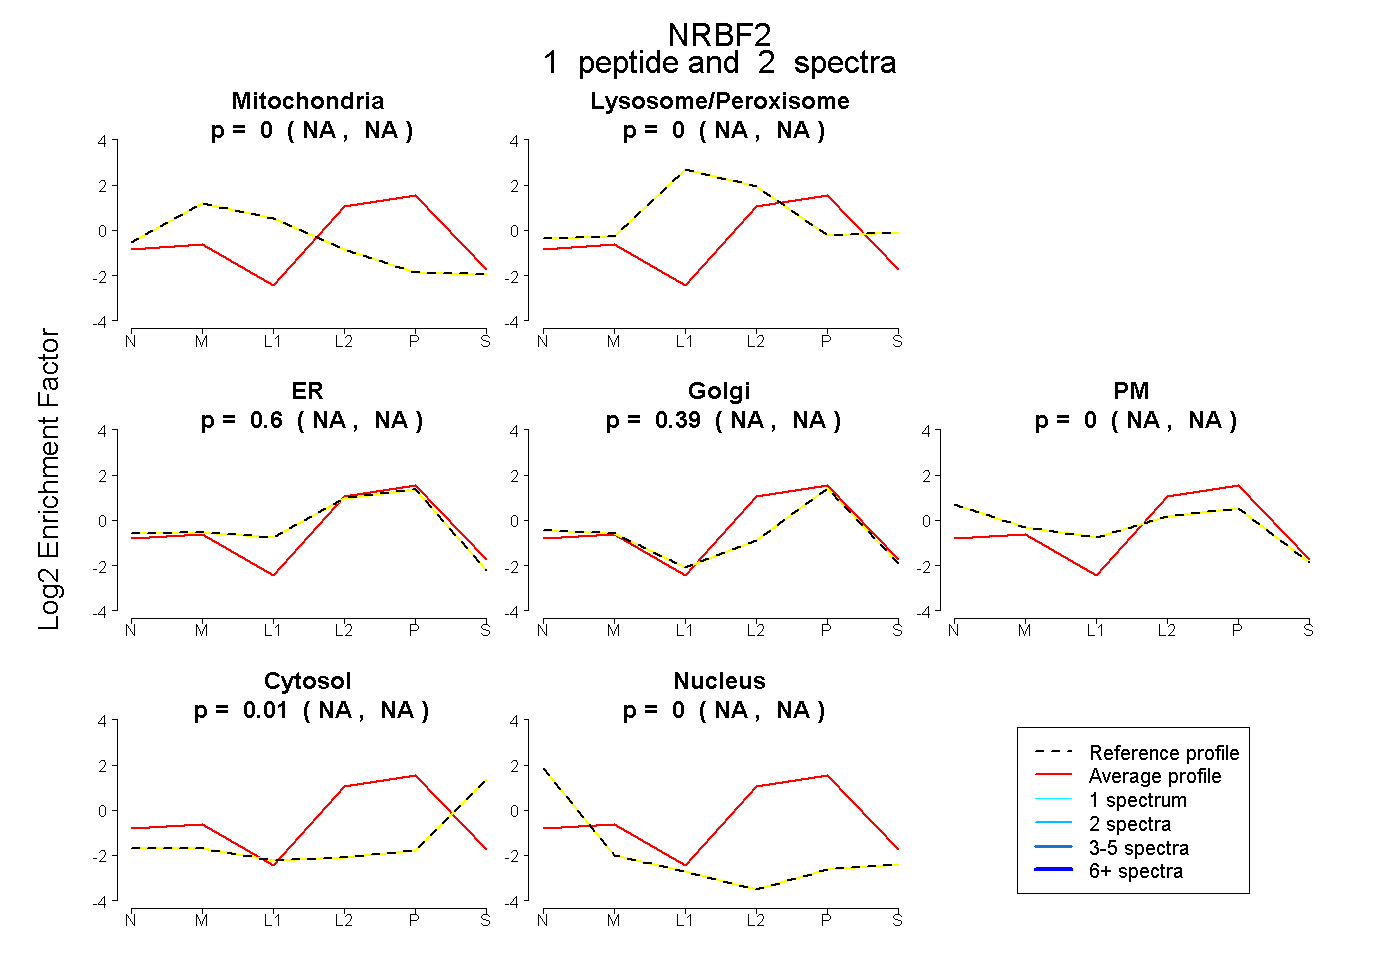 |
0.000 NA | NA |
0.000 NA | NA |
0.600 NA | NA |
0.387 NA | NA |
0.000 NA | NA |
0.013 NA | NA |
0.000 NA | NA |
|||
| Plot | Lyso | Other | |||||||||||
| Expt C |
2 peptides |
66 spectra |
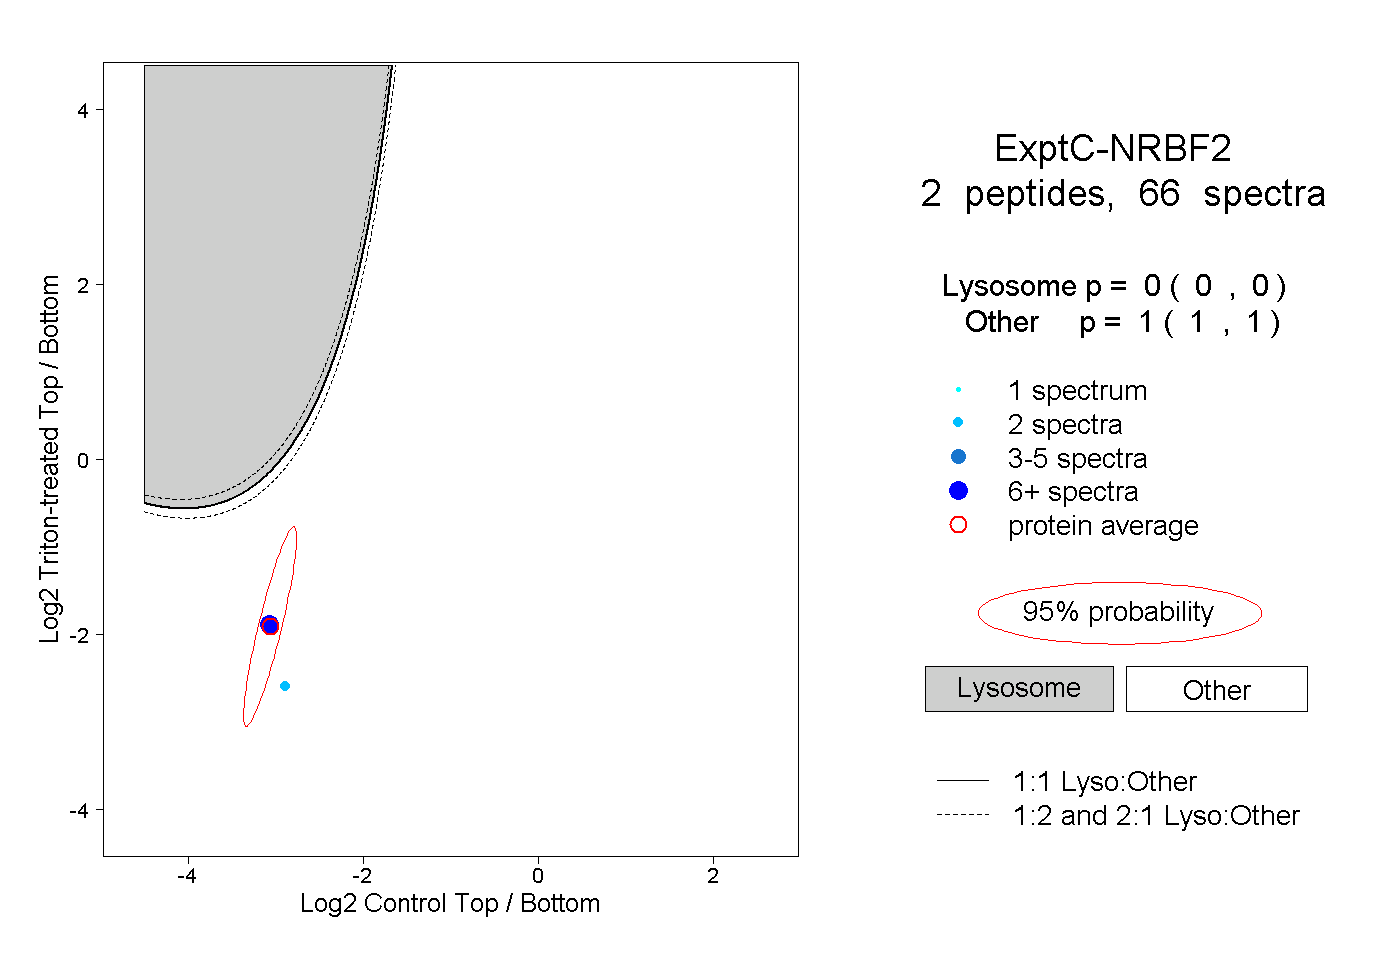 |
0.000 0.000 | 0.000 |
1.000 1.000 | 1.000 |
||||||||
| Plot | Lyso | Other | |||||||||||
| Expt D |
1 peptide |
6 spectra |
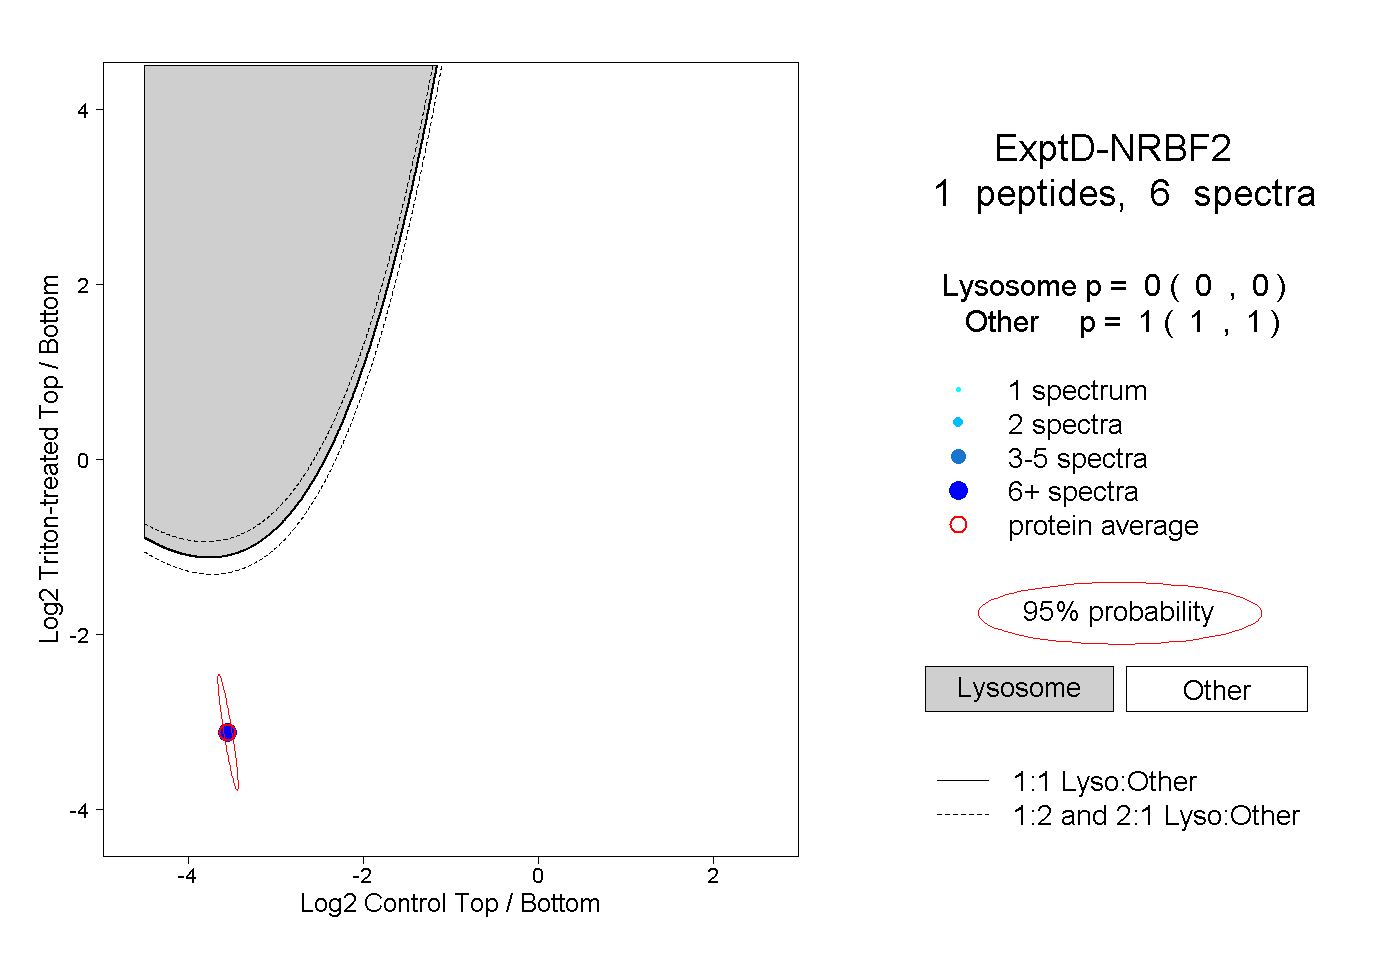 |
0.000 0.000 | 0.000 |
1.000 1.000 | 1.000 |