 6
6peptides
spectra
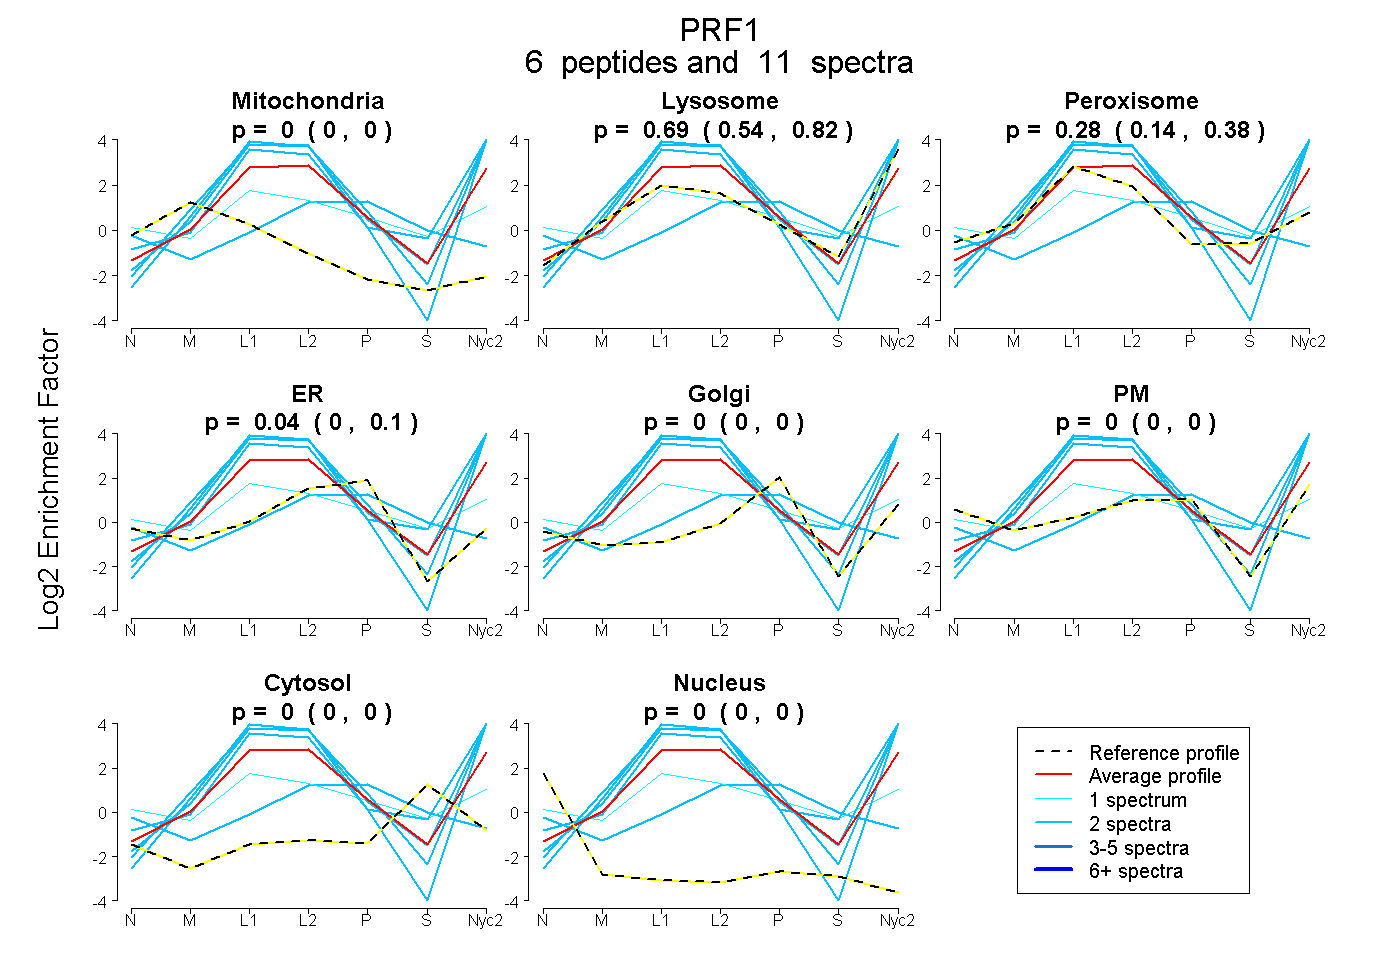
0.000 | 0.000
0.543 | 0.817
0.138 | 0.385
0.000 | 0.100
0.000 | 0.000
0.000 | 0.000
0.000 | 0.000
0.000 | 0.000
2peptides
spectra
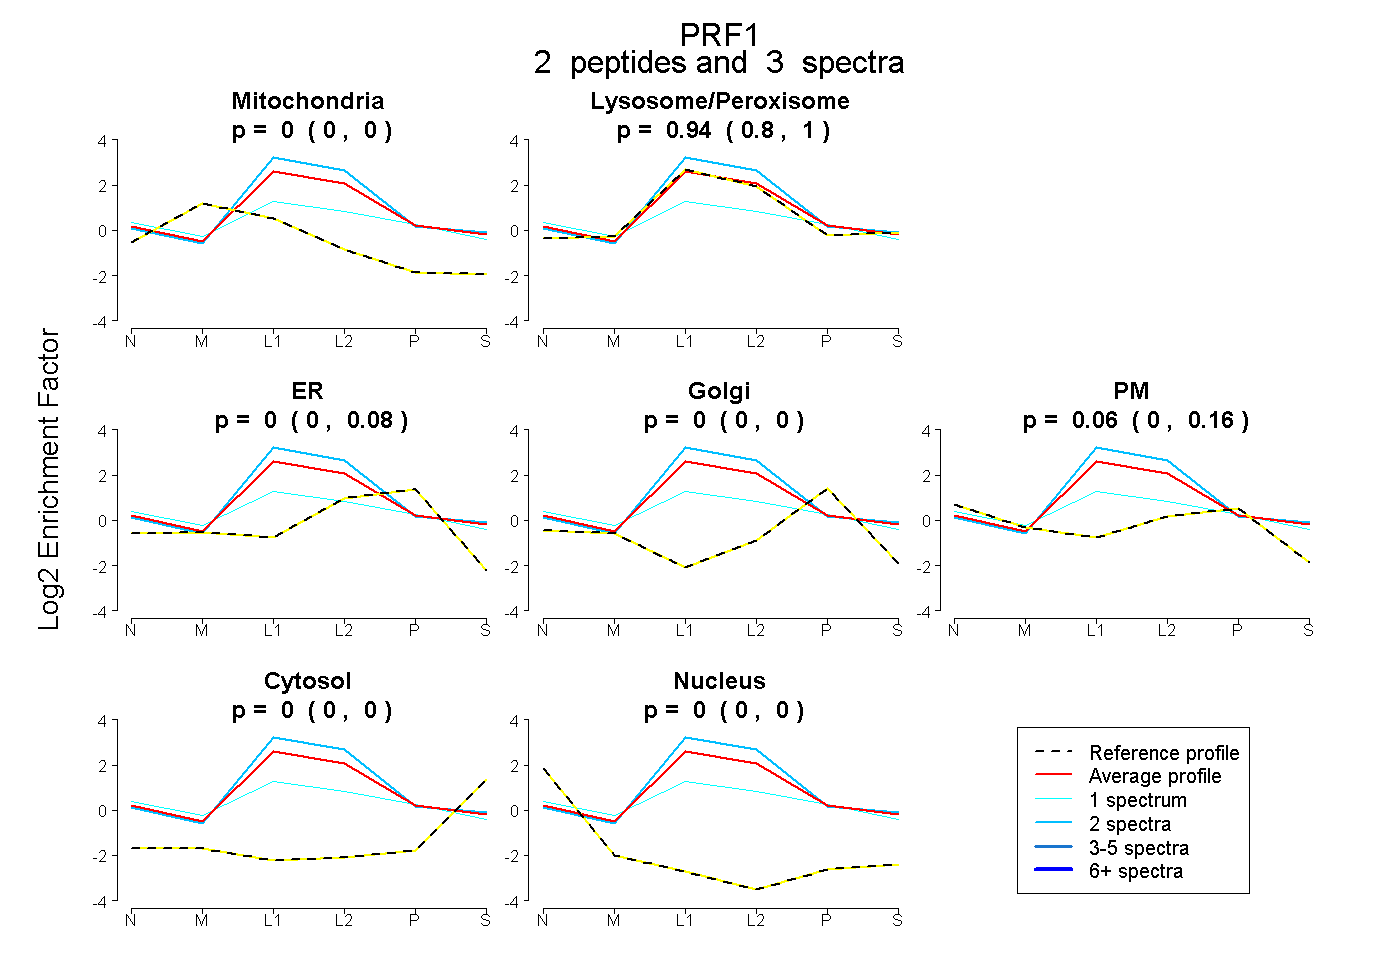
0.000 | 0.000
0.799 | 1.000
0.000 | 0.083
0.000 | 0.000
0.000 | 0.159
0.000 | 0.000
0.000 | 0.003
18peptides
spectra
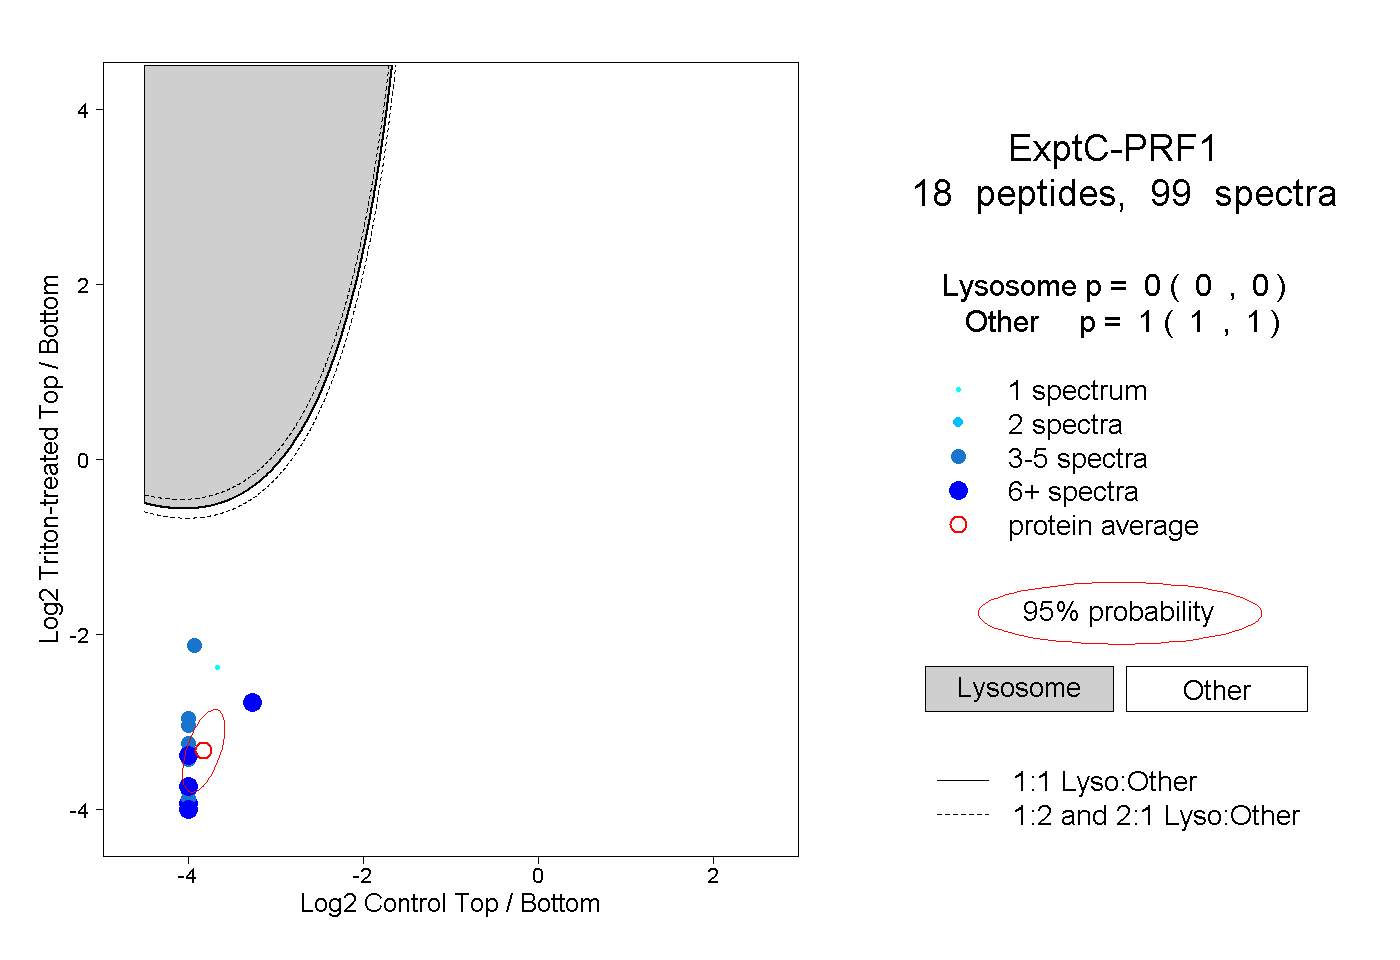
0.000 | 0.000
1.000 | 1.000
3peptides
spectra
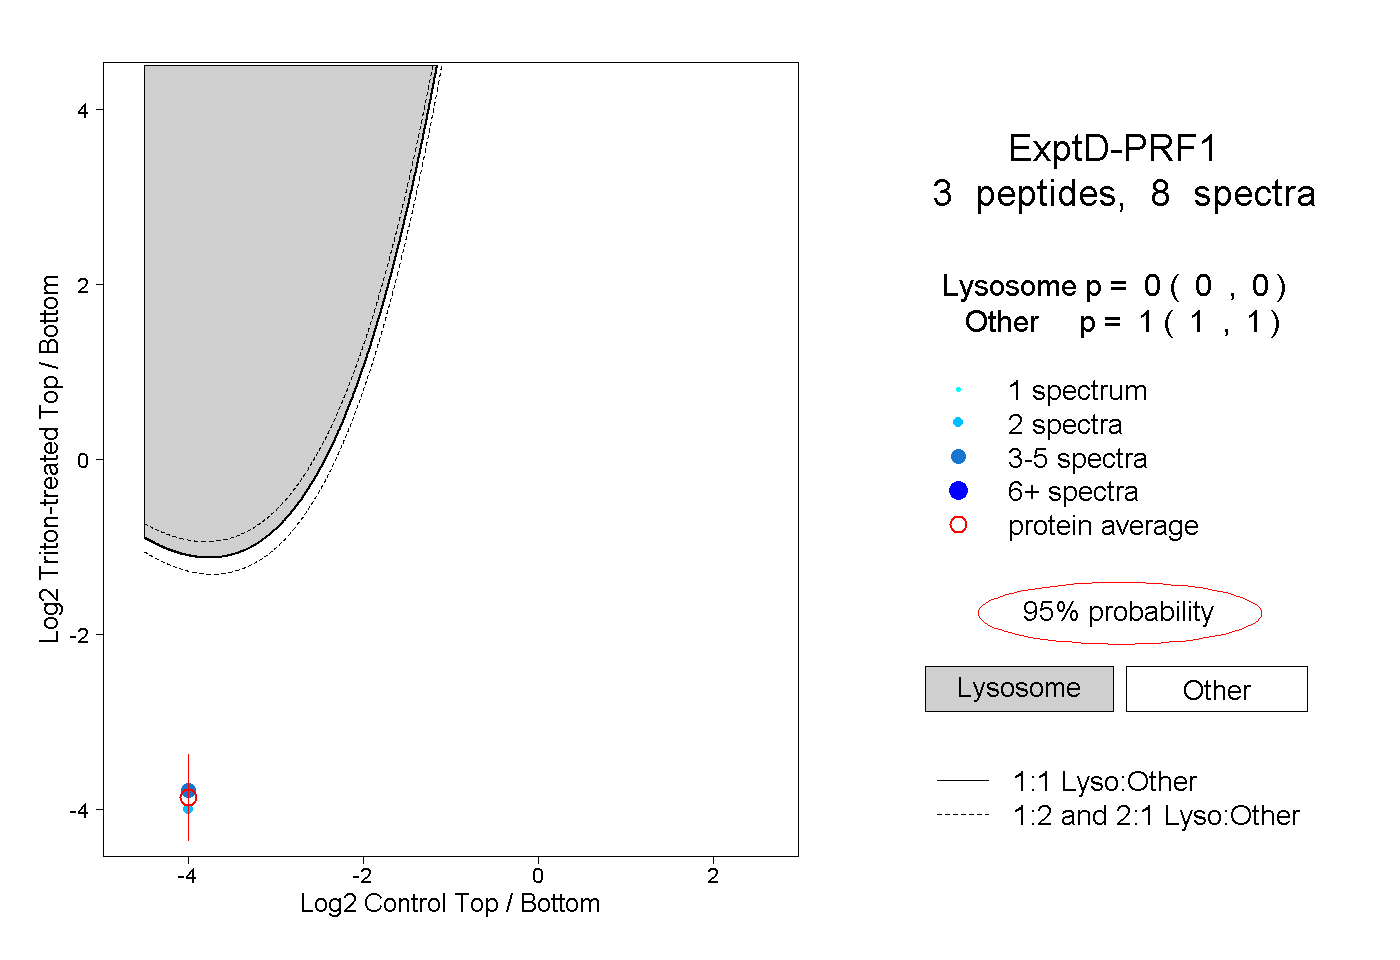
0.000 | 0.000
1.000 | 1.000