 6
6peptides
spectra
0.000 | 0.000
0.543 | 0.817
0.138 | 0.385
0.000 | 0.100
0.000 | 0.000
0.000 | 0.000
0.000 | 0.000
0.000 | 0.000
| Plot | Mito | Lyso | Perox | ER | Golgi | PM | Cytosol | Nucleus | |||||
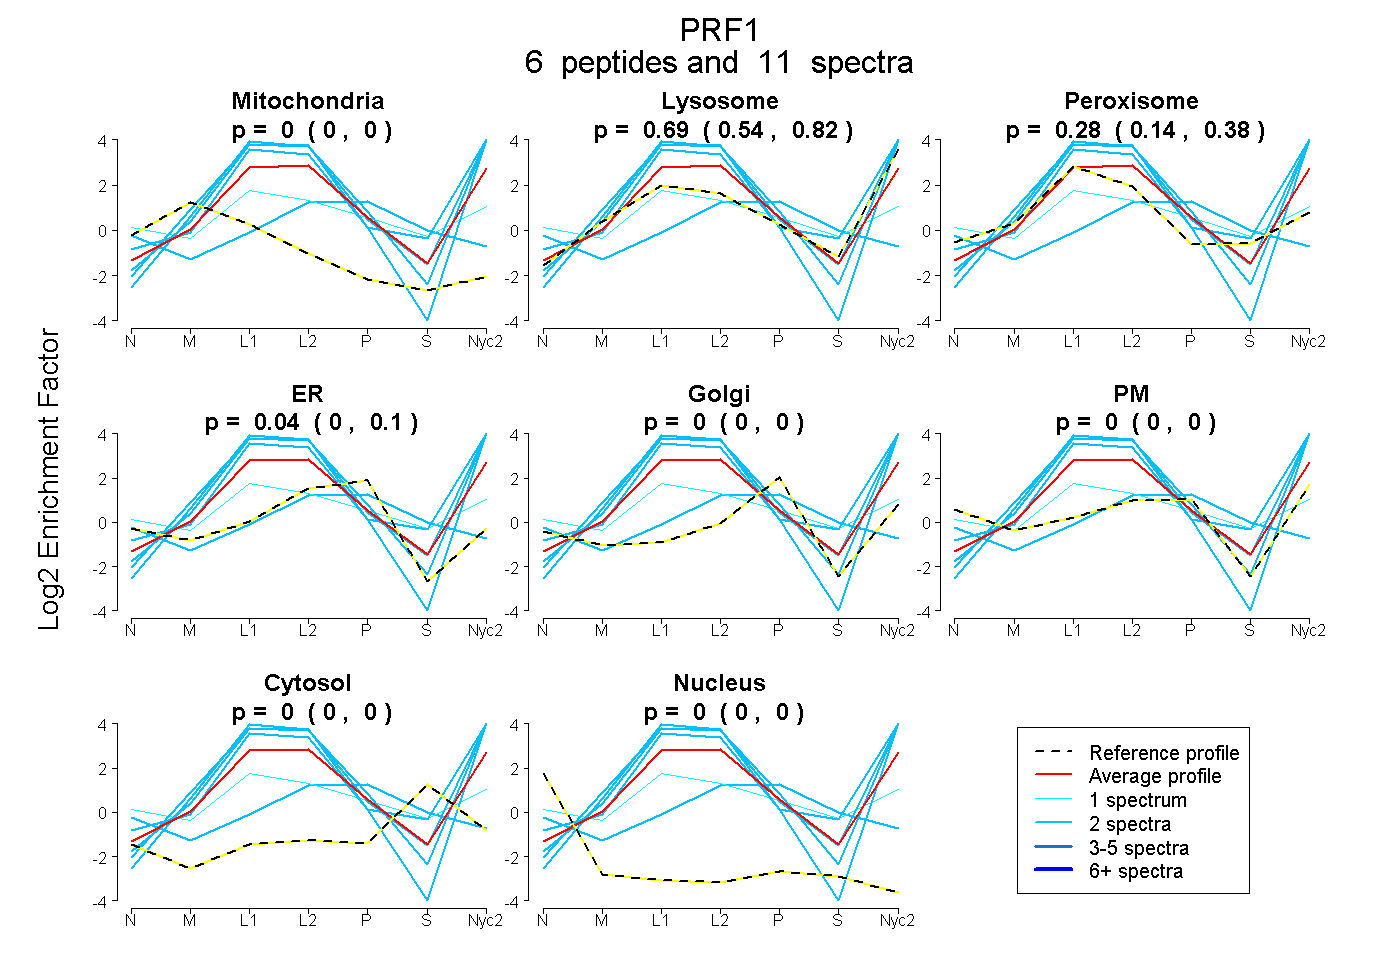
| Expt A |
6 peptides |
11 spectra |
|
0.000 0.000 | 0.000 |
0.687 0.543 | 0.817 |
0.276 0.138 | 0.385 |
0.037 0.000 | 0.100 |
0.000 0.000 | 0.000 |
0.000 0.000 | 0.000 |
0.000 0.000 | 0.000 |
0.000 0.000 | 0.000 |
| 2 spectra, VTNQDCCPR | 0.000 | 1.000 | 0.000 | 0.000 | 0.000 | 0.000 | 0.000 | 0.000 | ||
| 1 spectrum, AHQDQYNFNTDTVECR | 0.000 | 0.000 | 0.611 | 0.000 | 0.068 | 0.240 | 0.081 | 0.000 | ||
| 2 spectra, VFFGGQEIR | 0.000 | 1.000 | 0.000 | 0.000 | 0.000 | 0.000 | 0.000 | 0.000 | ||
| 2 spectra, FLRPDR | 0.000 | 1.000 | 0.000 | 0.000 | 0.000 | 0.000 | 0.000 | 0.000 | ||
| 2 spectra, VSSTEGVAR | 0.000 | 0.811 | 0.189 | 0.000 | 0.000 | 0.000 | 0.000 | 0.000 | ||
| 2 spectra, ACEEK | 0.000 | 0.000 | 0.126 | 0.542 | 0.000 | 0.000 | 0.332 | 0.000 |
| Plot | Mito | Lyso or Perox | ER | Golgi | PM | Cytosol | Nucleus | ||||||
| Expt B |
2 peptides |
3 spectra |
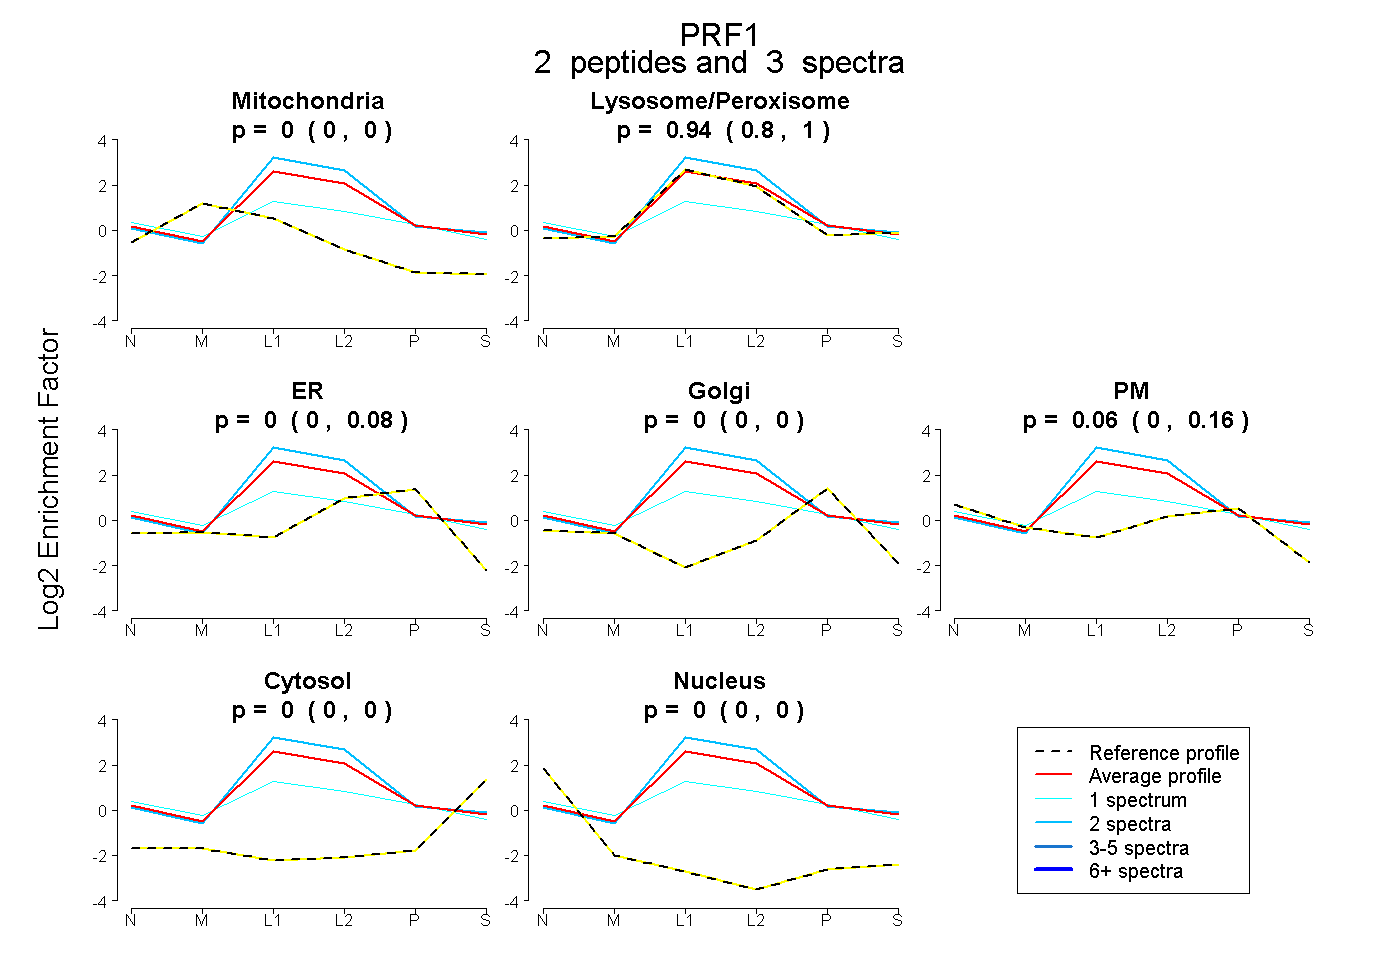 |
0.000 0.000 | 0.000 |
0.939 0.799 | 1.000 |
0.000 0.000 | 0.083 |
0.000 0.000 | 0.000 |
0.061 0.000 | 0.159 |
0.000 0.000 | 0.000 |
0.000 0.000 | 0.003 |
|||
| Plot | Lyso | Other | |||||||||||
| Expt C |
18 peptides |
99 spectra |
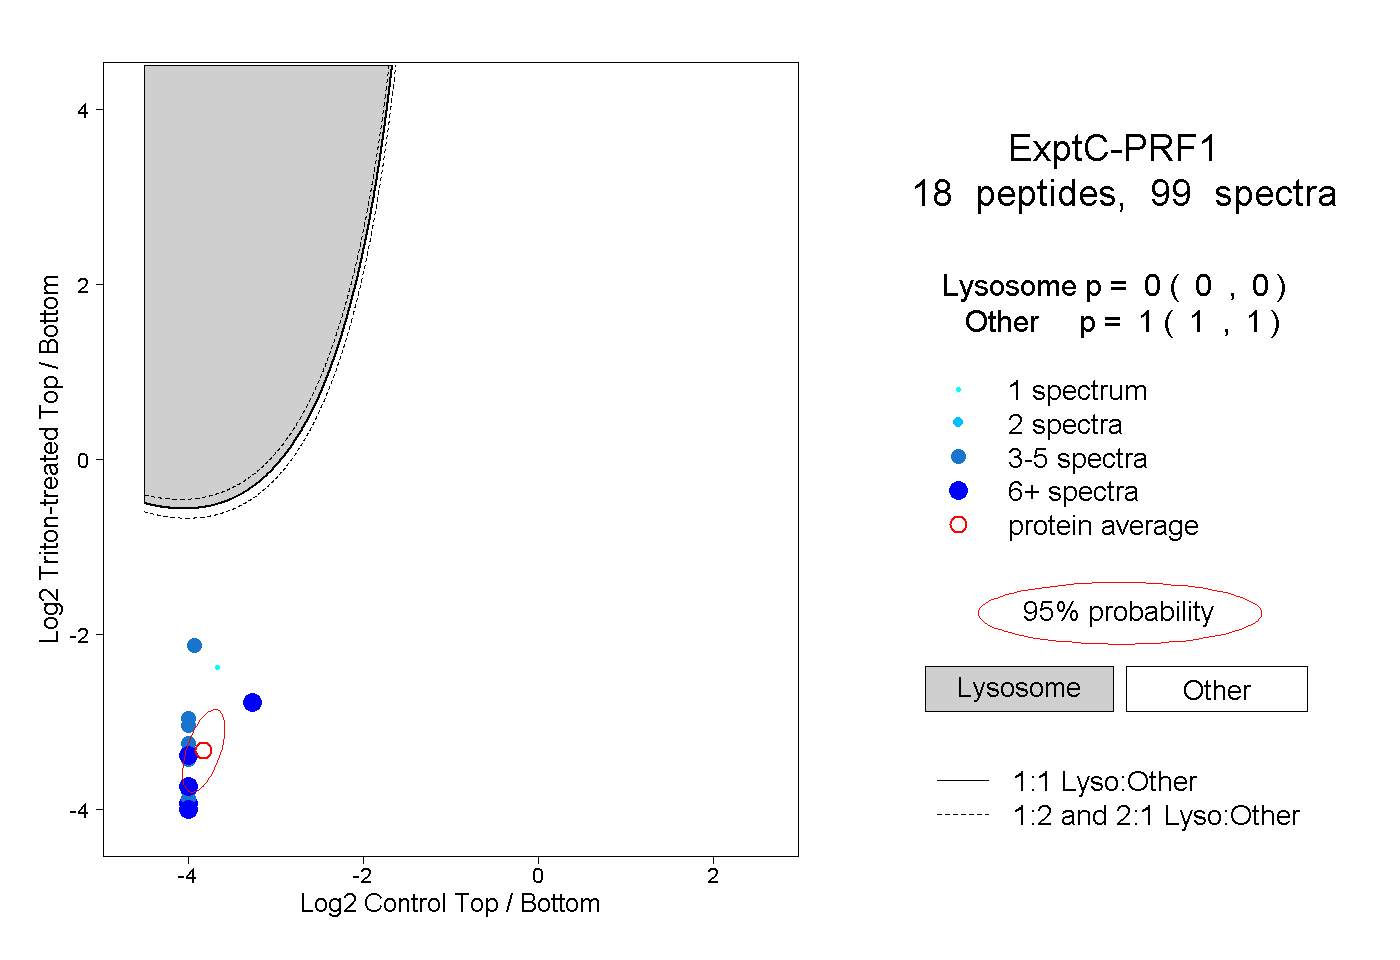 |
0.000 0.000 | 0.000 |
1.000 1.000 | 1.000 |
||||||||
| Plot | Lyso | Other | |||||||||||
| Expt D |
3 peptides |
8 spectra |
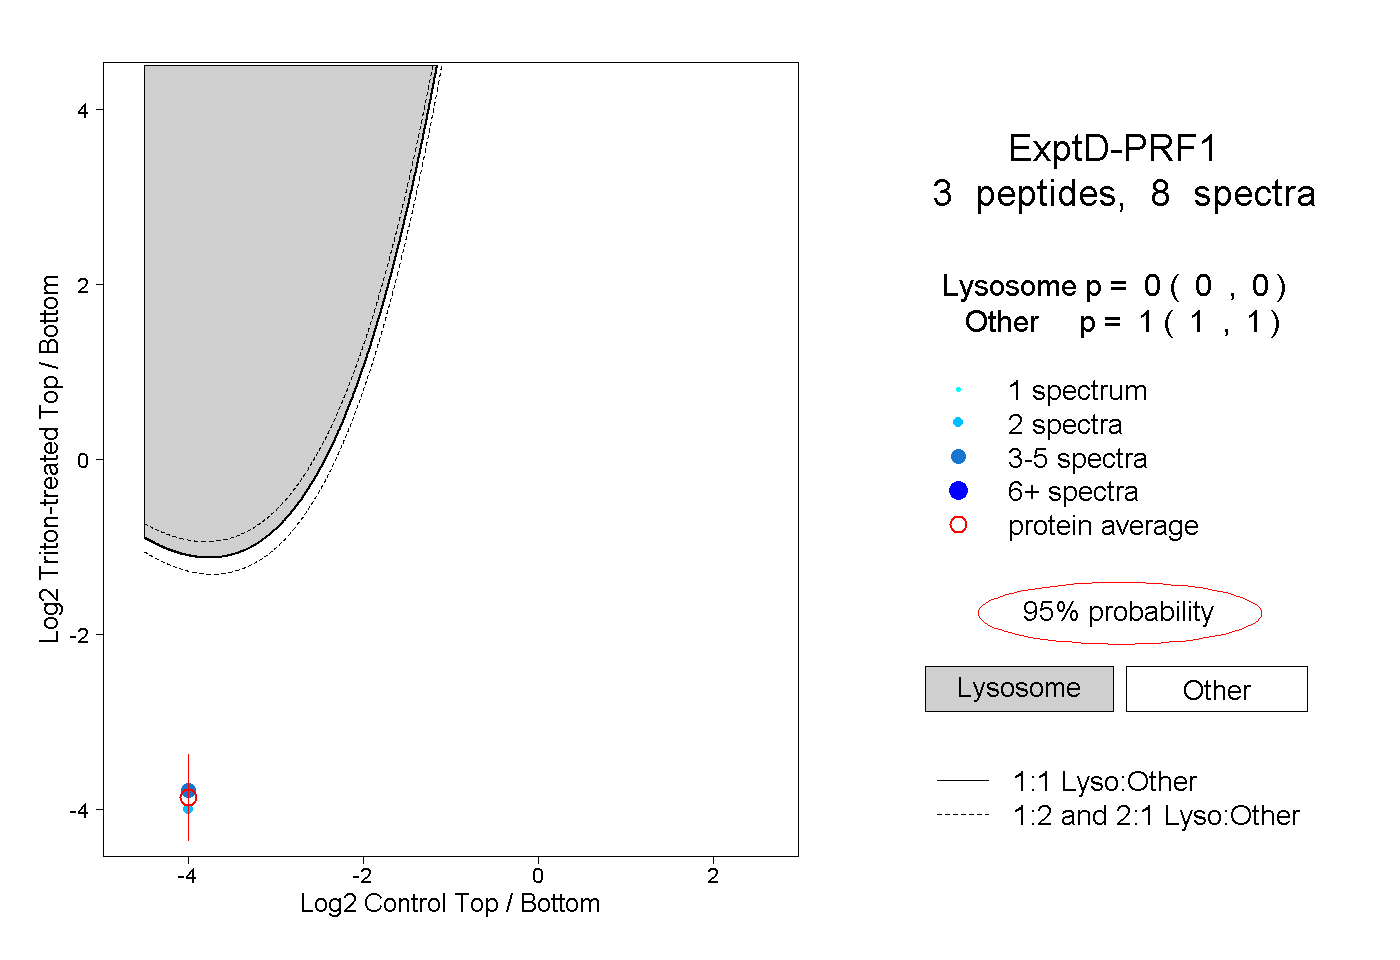 |
0.000 0.000 | 0.000 |
1.000 1.000 | 1.000 |