 7
7peptides
spectra
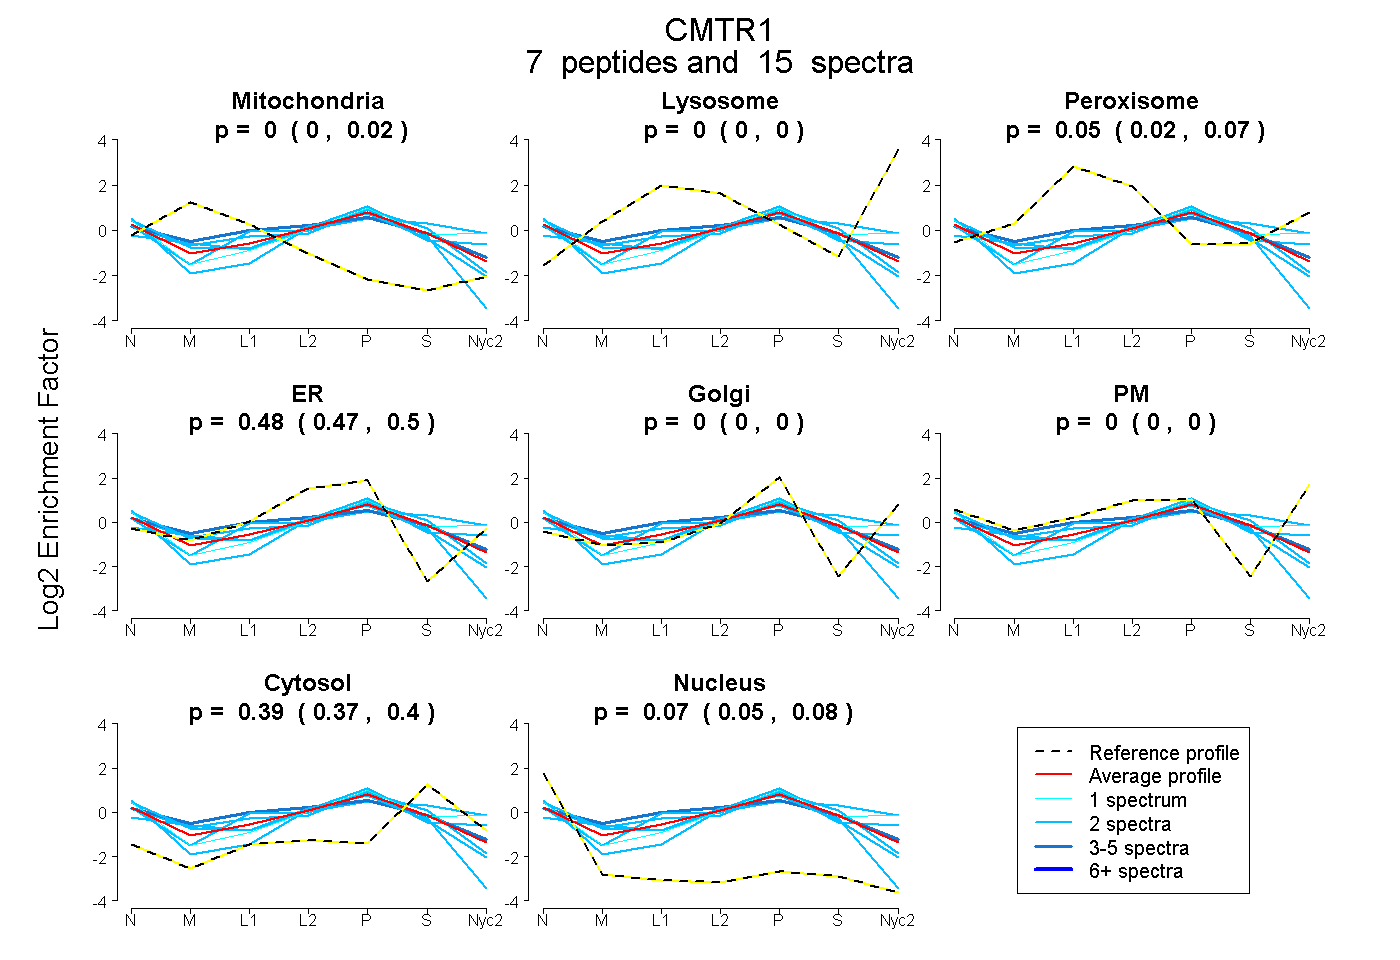
0.000 | 0.021
0.000 | 0.000
0.025 | 0.071
0.471 | 0.498
0.000 | 0.000
0.000 | 0.000
0.371 | 0.404
0.054 | 0.084
2peptides
spectra
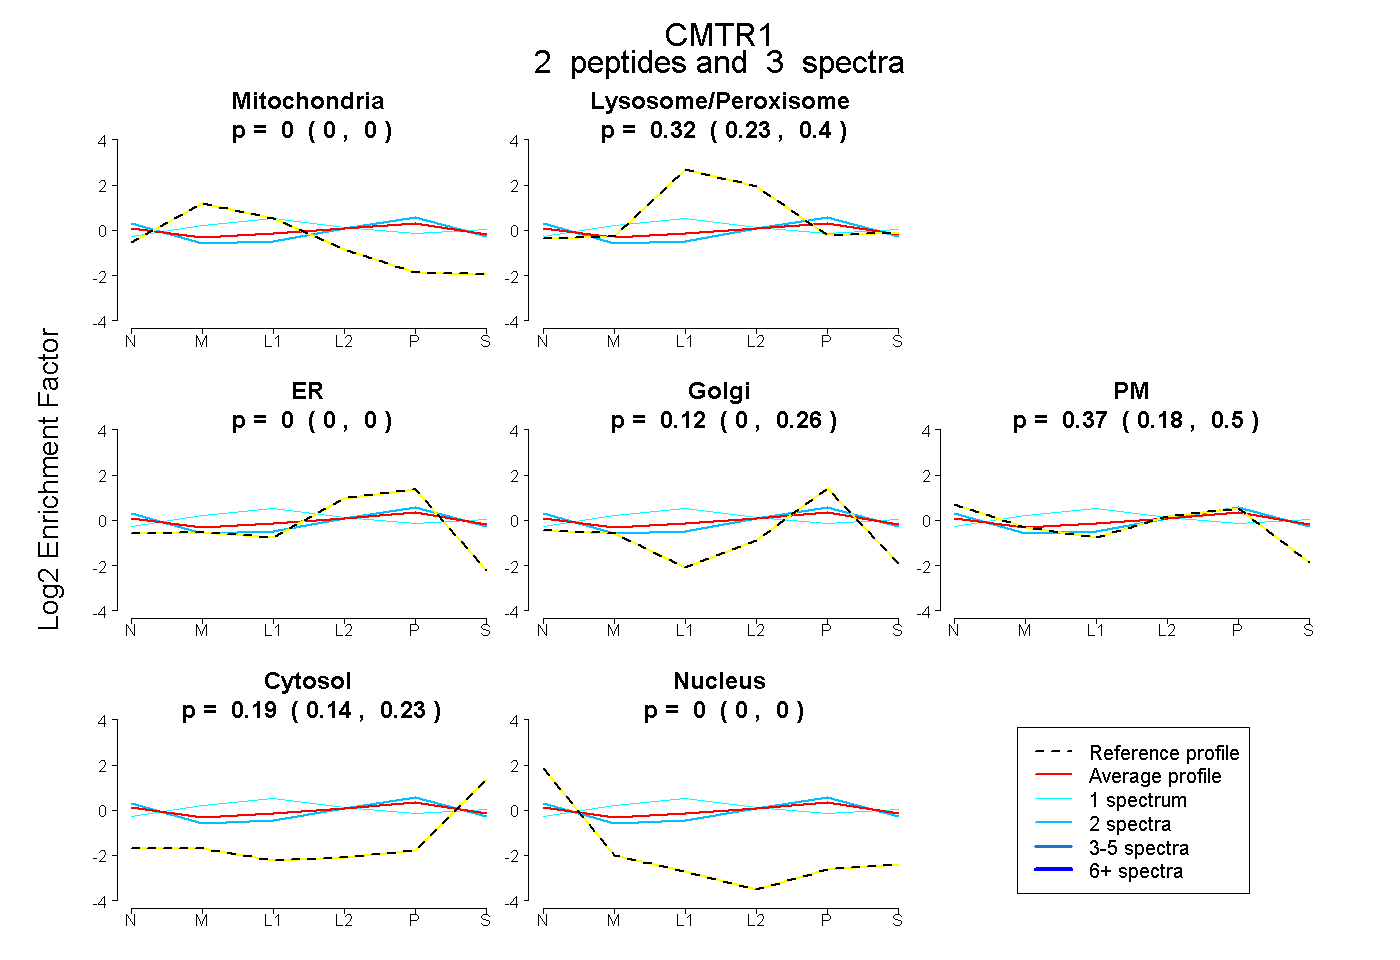
0.000 | 0.000
0.228 | 0.401
0.000 | 0.000
0.000 | 0.260
0.175 | 0.502
0.137 | 0.233
0.000 | 0.000
5peptides
spectra
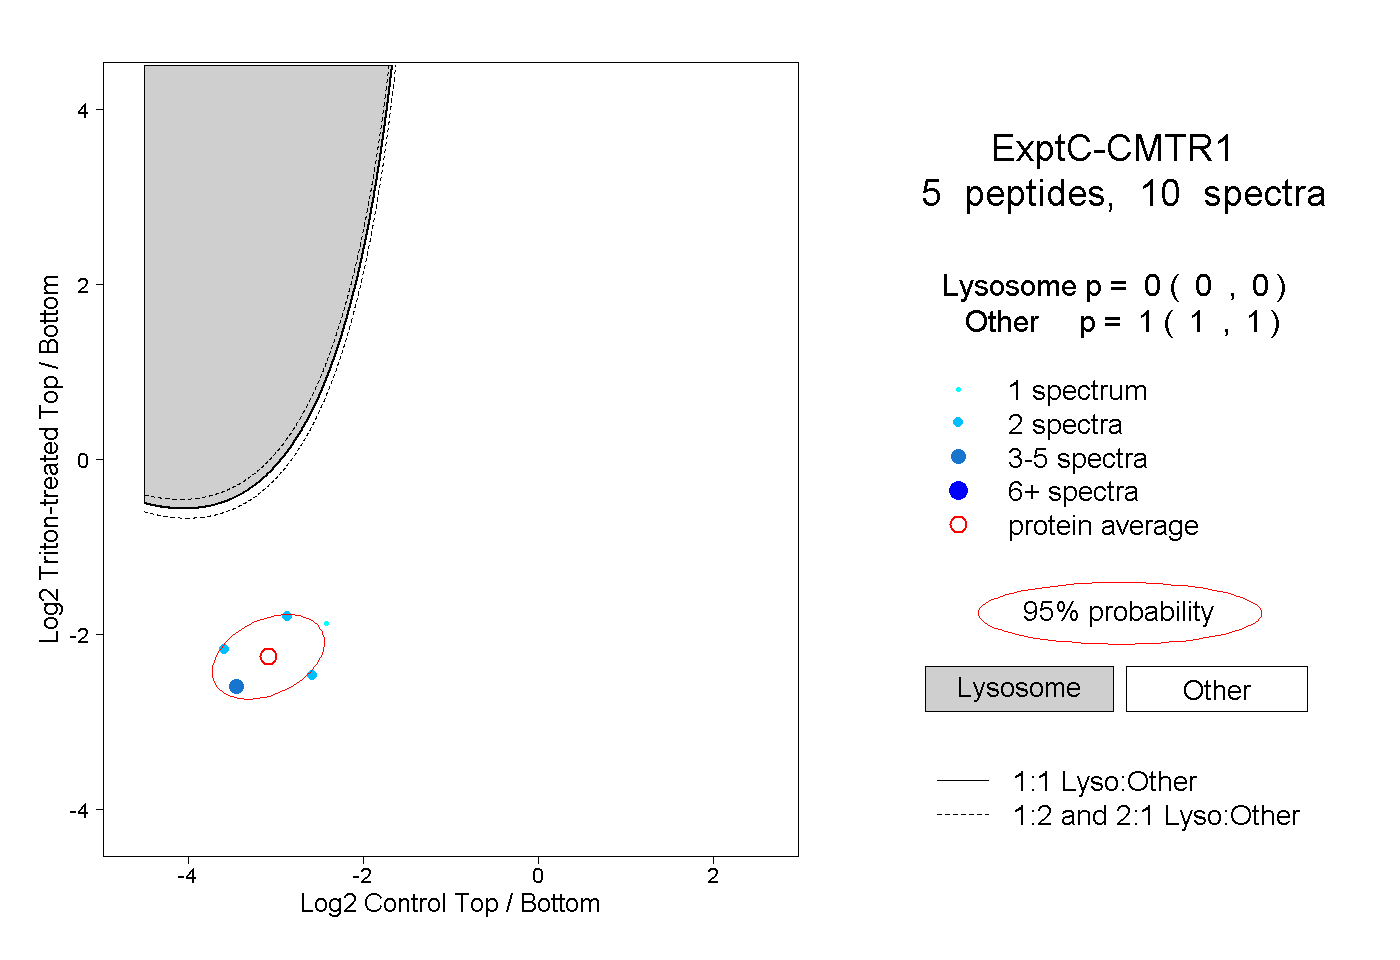
0.000 | 0.000
1.000 | 1.000
1peptide
spectrum
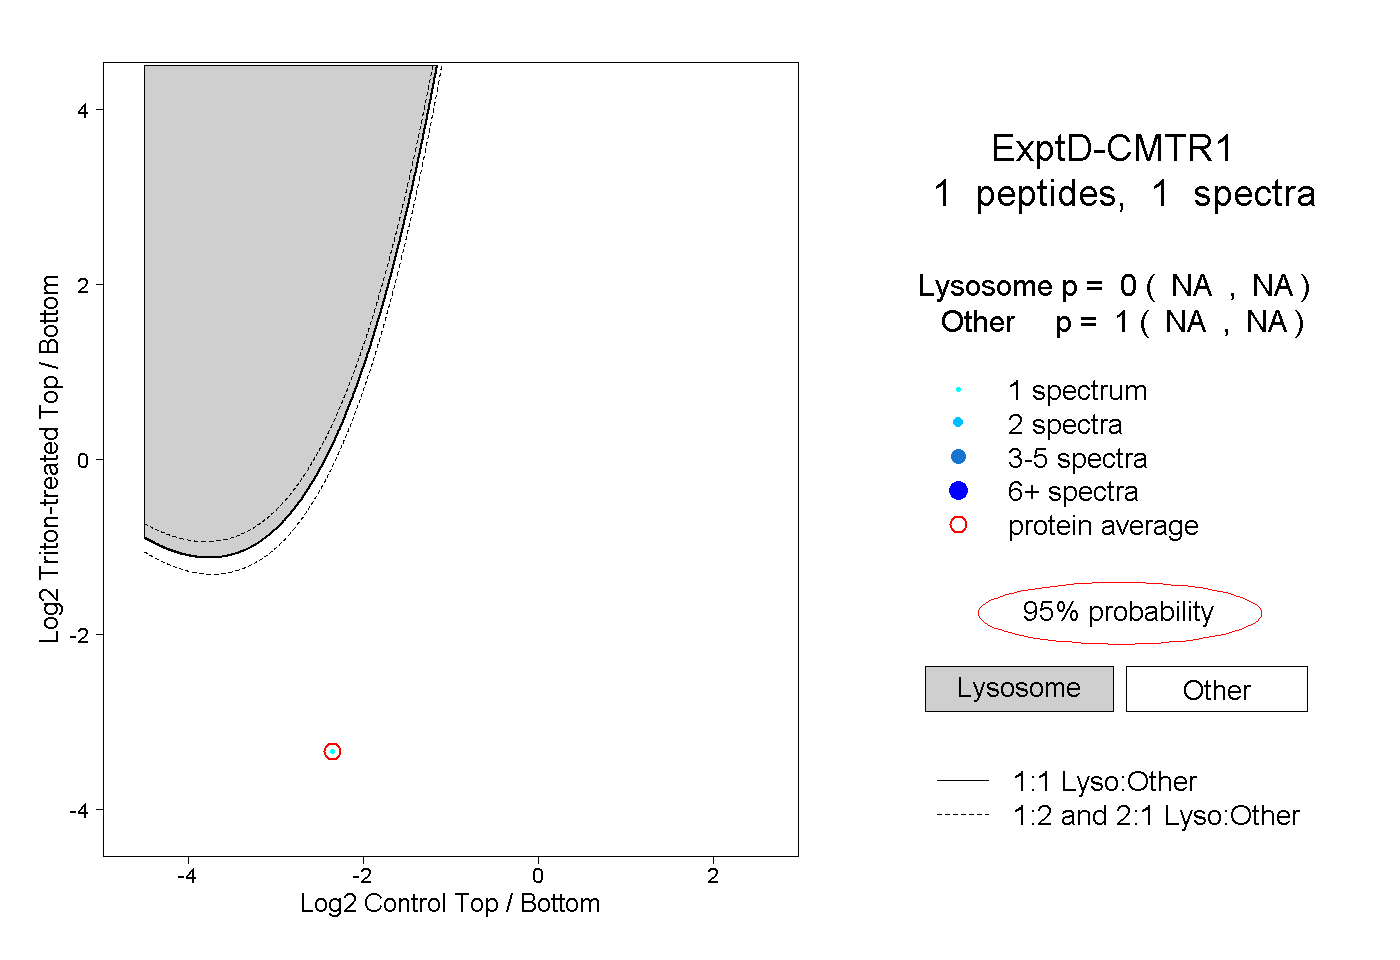
NA | NA
NA | NA