 7
7peptides
spectra
0.000 | 0.021
0.000 | 0.000
0.025 | 0.071
0.471 | 0.498
0.000 | 0.000
0.000 | 0.000
0.371 | 0.404
0.054 | 0.084
| Plot | Mito | Lyso | Perox | ER | Golgi | PM | Cytosol | Nucleus | |||||
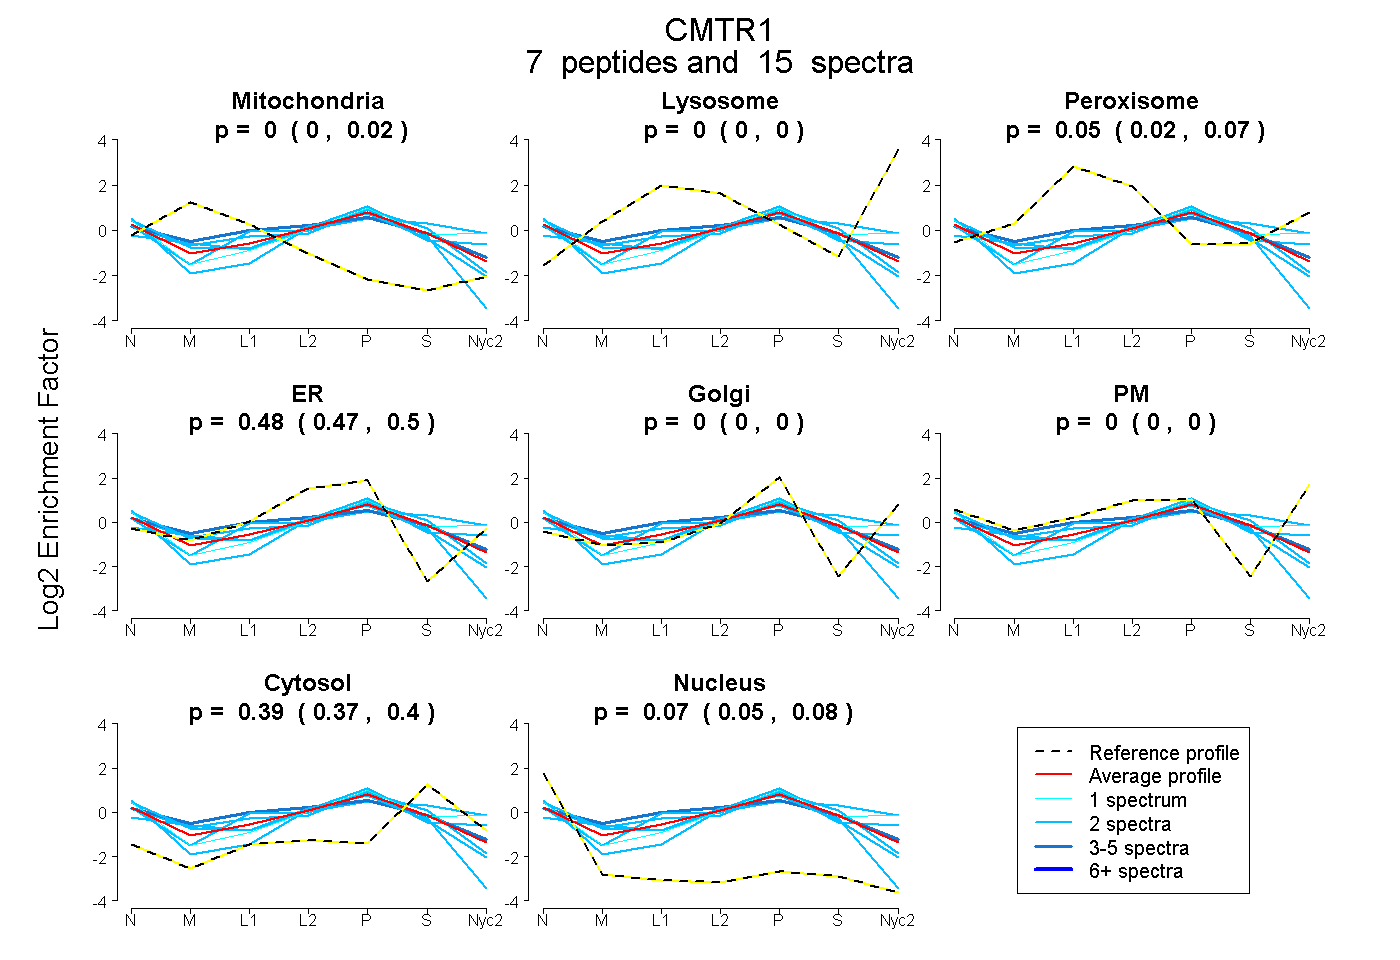
| Expt A |
7 peptides |
15 spectra |
|
0.000 0.000 | 0.021 |
0.000 0.000 | 0.000 |
0.054 0.025 | 0.071 |
0.485 0.471 | 0.498 |
0.000 0.000 | 0.000 |
0.000 0.000 | 0.000 |
0.388 0.371 | 0.404 |
0.073 0.054 | 0.084 |
| 4 spectra, HFVPTGVYIVR | 0.100 | 0.000 | 0.159 | 0.387 | 0.000 | 0.000 | 0.332 | 0.023 | ||
| 2 spectra, AVSKPSRPDMNPIR | 0.040 | 0.000 | 0.138 | 0.261 | 0.238 | 0.000 | 0.288 | 0.035 | ||
| 1 spectrum, VGIDDVR | 0.000 | 0.000 | 0.000 | 0.205 | 0.152 | 0.222 | 0.411 | 0.010 | ||
| 2 spectra, NFVLDNTDR | 0.078 | 0.000 | 0.000 | 0.503 | 0.000 | 0.000 | 0.314 | 0.105 | ||
| 2 spectra, SVFDILDGEEMR | 0.000 | 0.000 | 0.067 | 0.447 | 0.000 | 0.000 | 0.415 | 0.070 | ||
| 2 spectra, GVFFLNR | 0.000 | 0.000 | 0.000 | 0.446 | 0.000 | 0.000 | 0.288 | 0.266 | ||
| 2 spectra, GDHEFNDYMIR | 0.000 | 0.000 | 0.117 | 0.113 | 0.161 | 0.145 | 0.463 | 0.000 |
| Plot | Mito | Lyso or Perox | ER | Golgi | PM | Cytosol | Nucleus | ||||||
| Expt B |
2 peptides |
3 spectra |
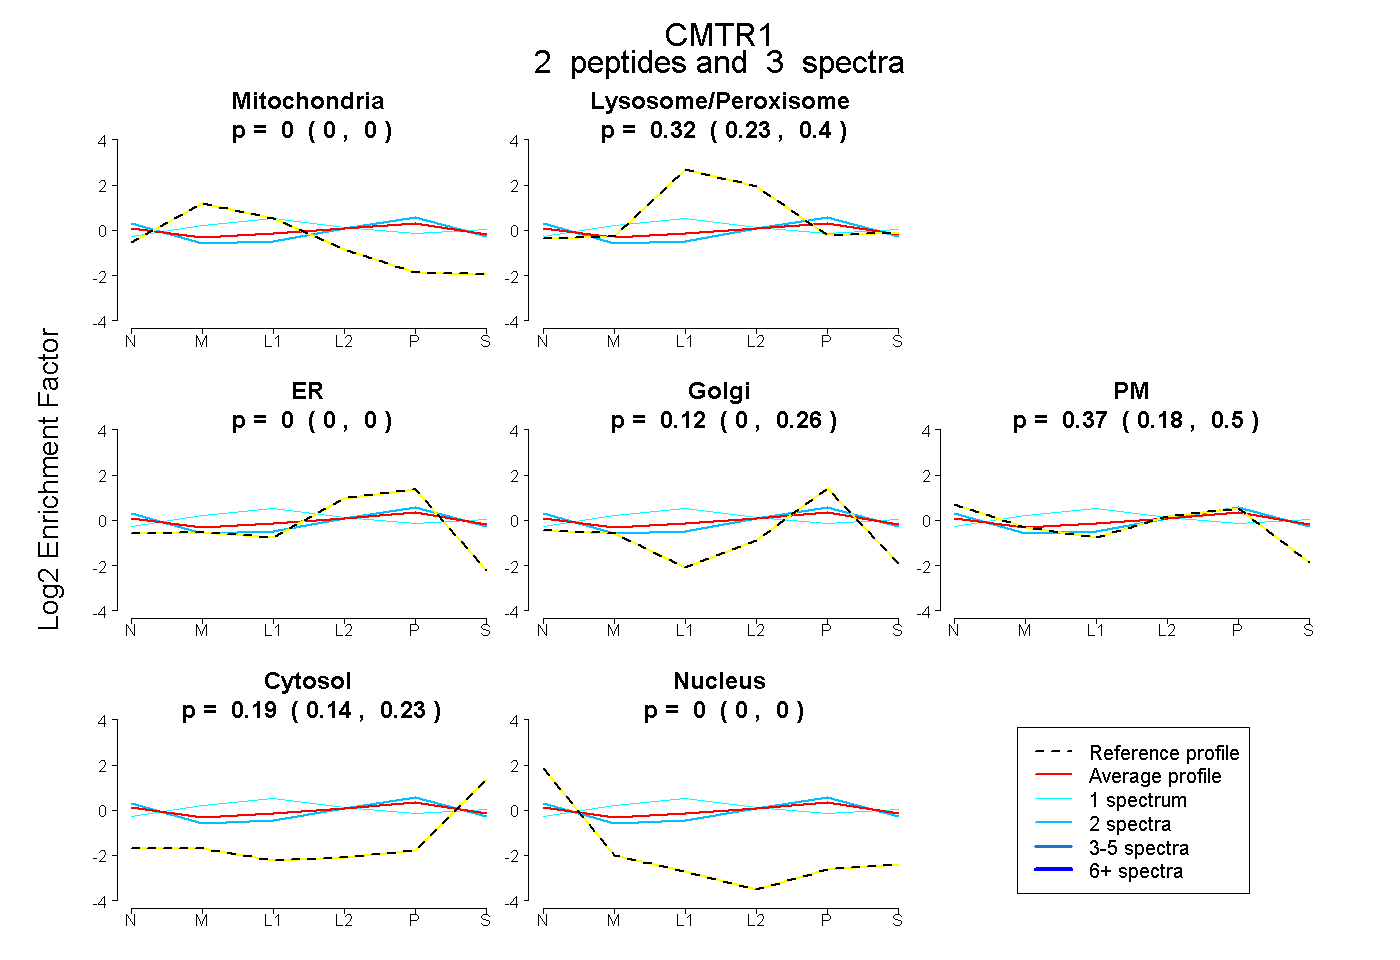 |
0.000 0.000 | 0.000 |
0.320 0.228 | 0.401 |
0.000 0.000 | 0.000 |
0.123 0.000 | 0.260 |
0.366 0.175 | 0.502 |
0.190 0.137 | 0.233 |
0.000 0.000 | 0.000 |
|||
| Plot | Lyso | Other | |||||||||||
| Expt C |
5 peptides |
10 spectra |
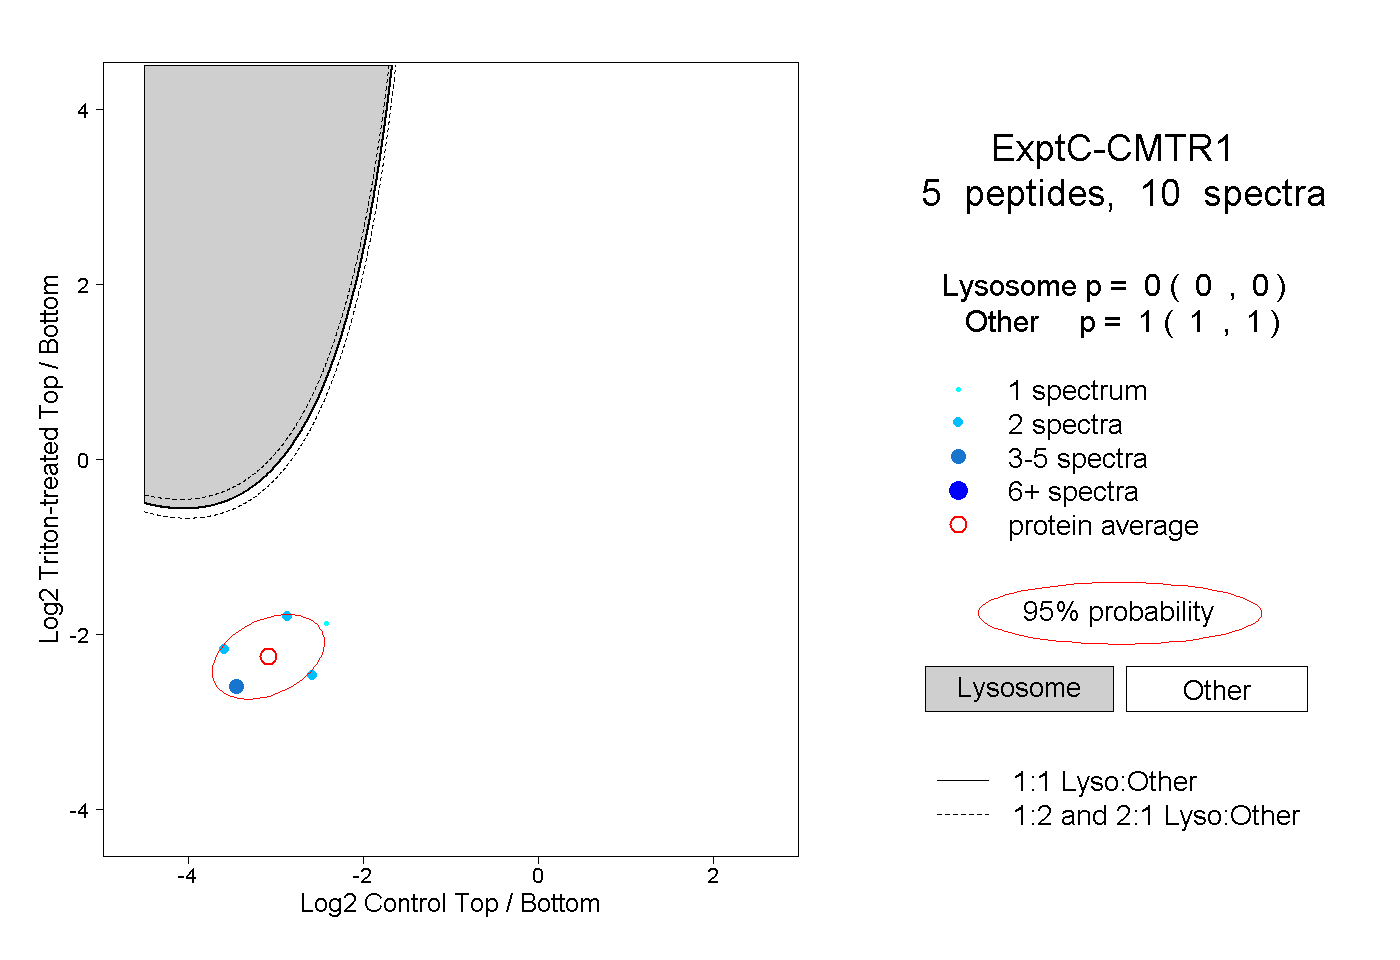 |
0.000 0.000 | 0.000 |
1.000 1.000 | 1.000 |
||||||||
| Plot | Lyso | Other | |||||||||||
| Expt D |
1 peptide |
1 spectrum |
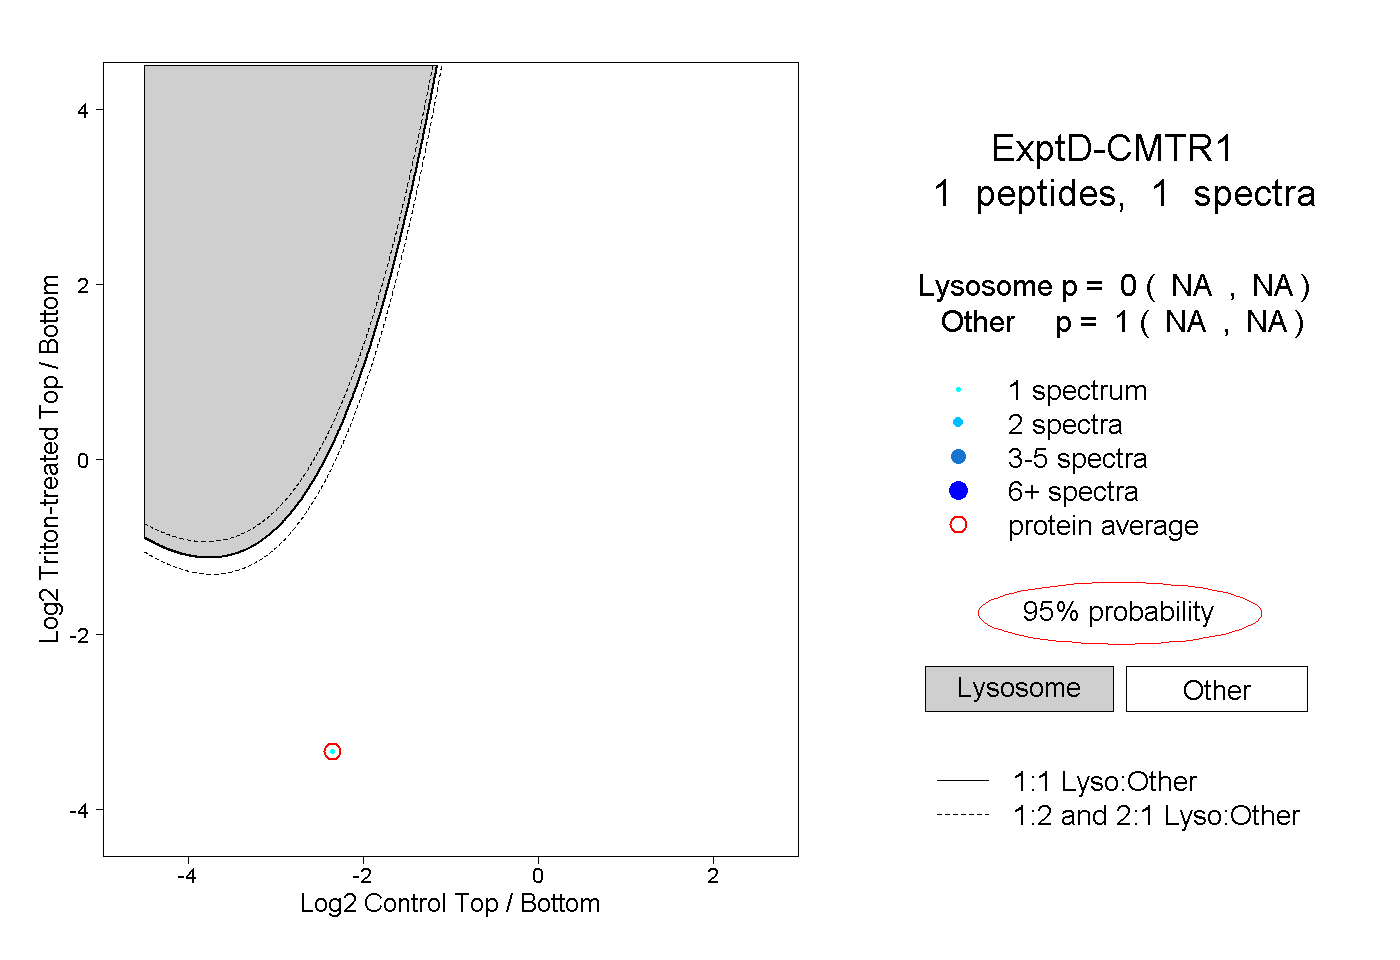 |
0.000 NA | NA |
1.000 NA | NA |