 7
7peptides
spectra
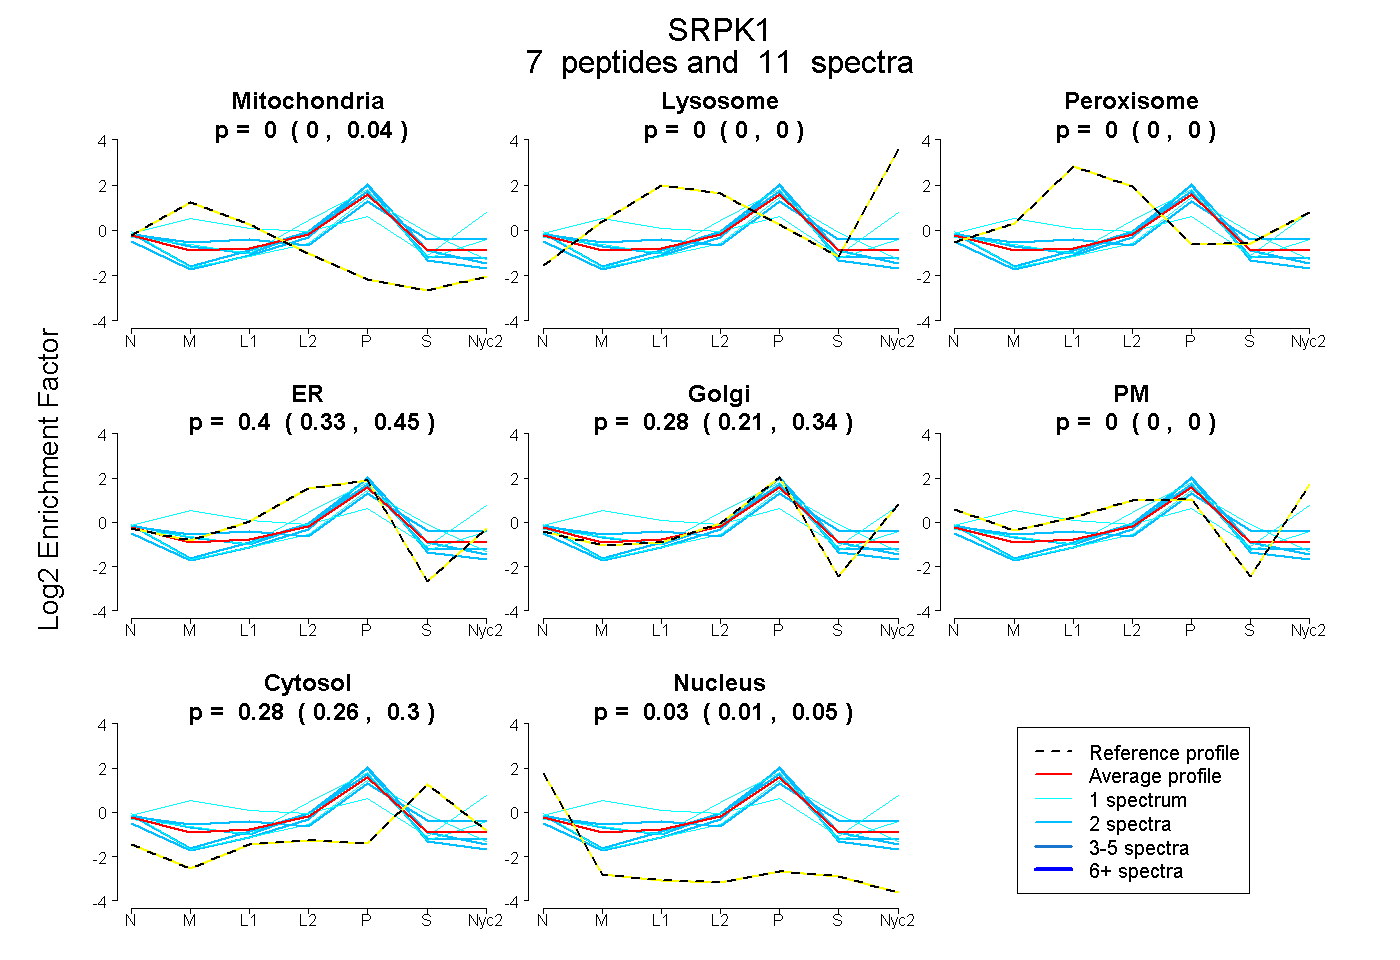
0.000 | 0.036
0.000 | 0.000
0.000 | 0.000
0.329 | 0.447
0.208 | 0.345
0.000 | 0.000
0.259 | 0.299
0.007 | 0.050
1peptide
spectrum
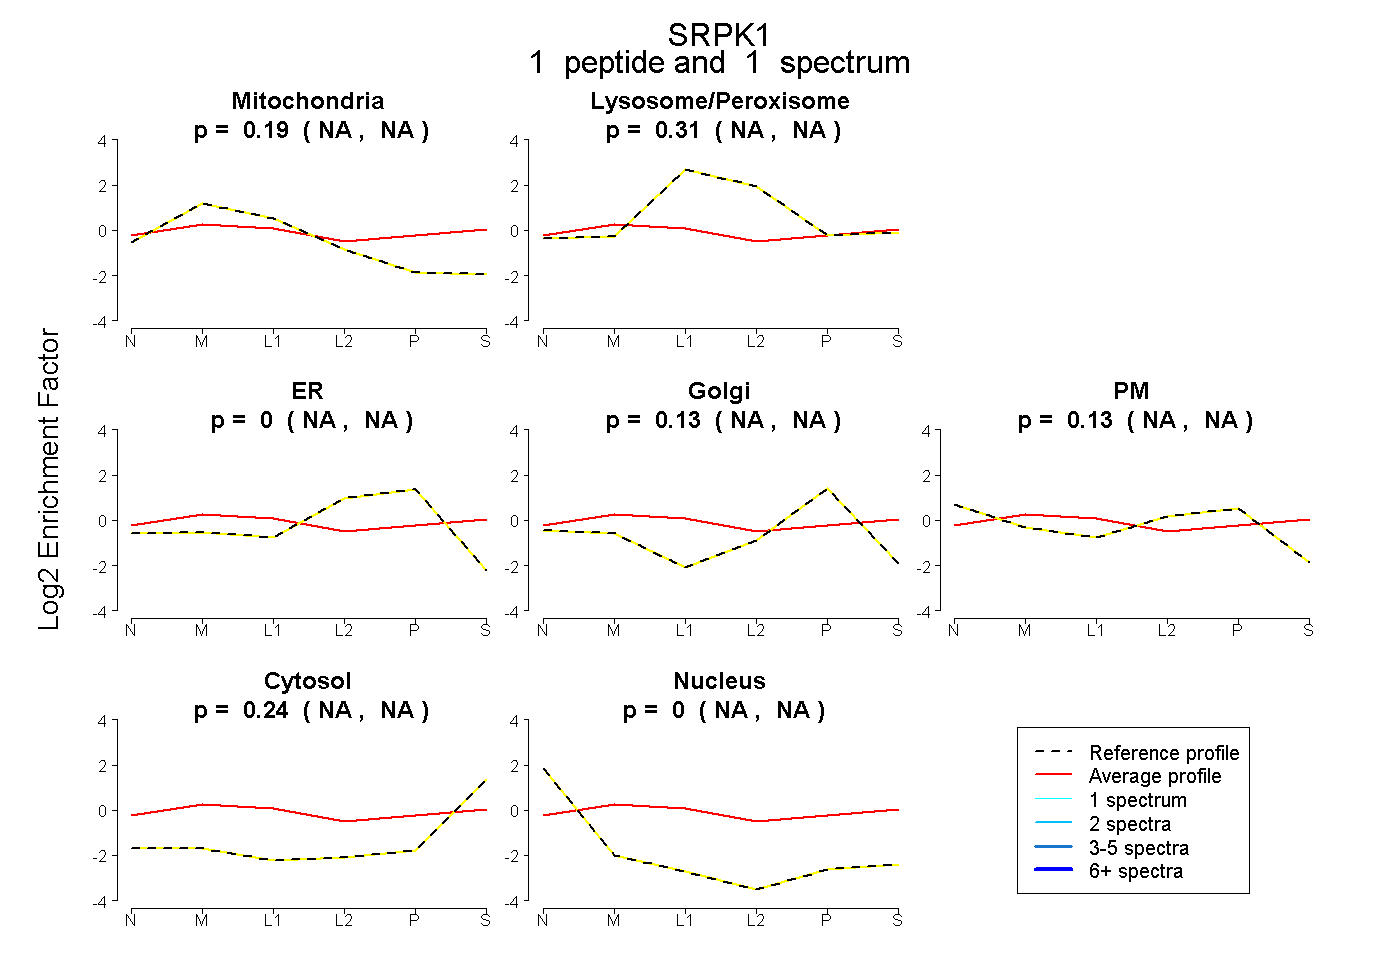
NA | NA
NA | NA
NA | NA
NA | NA
NA | NA
NA | NA
NA | NA
4peptides
spectra
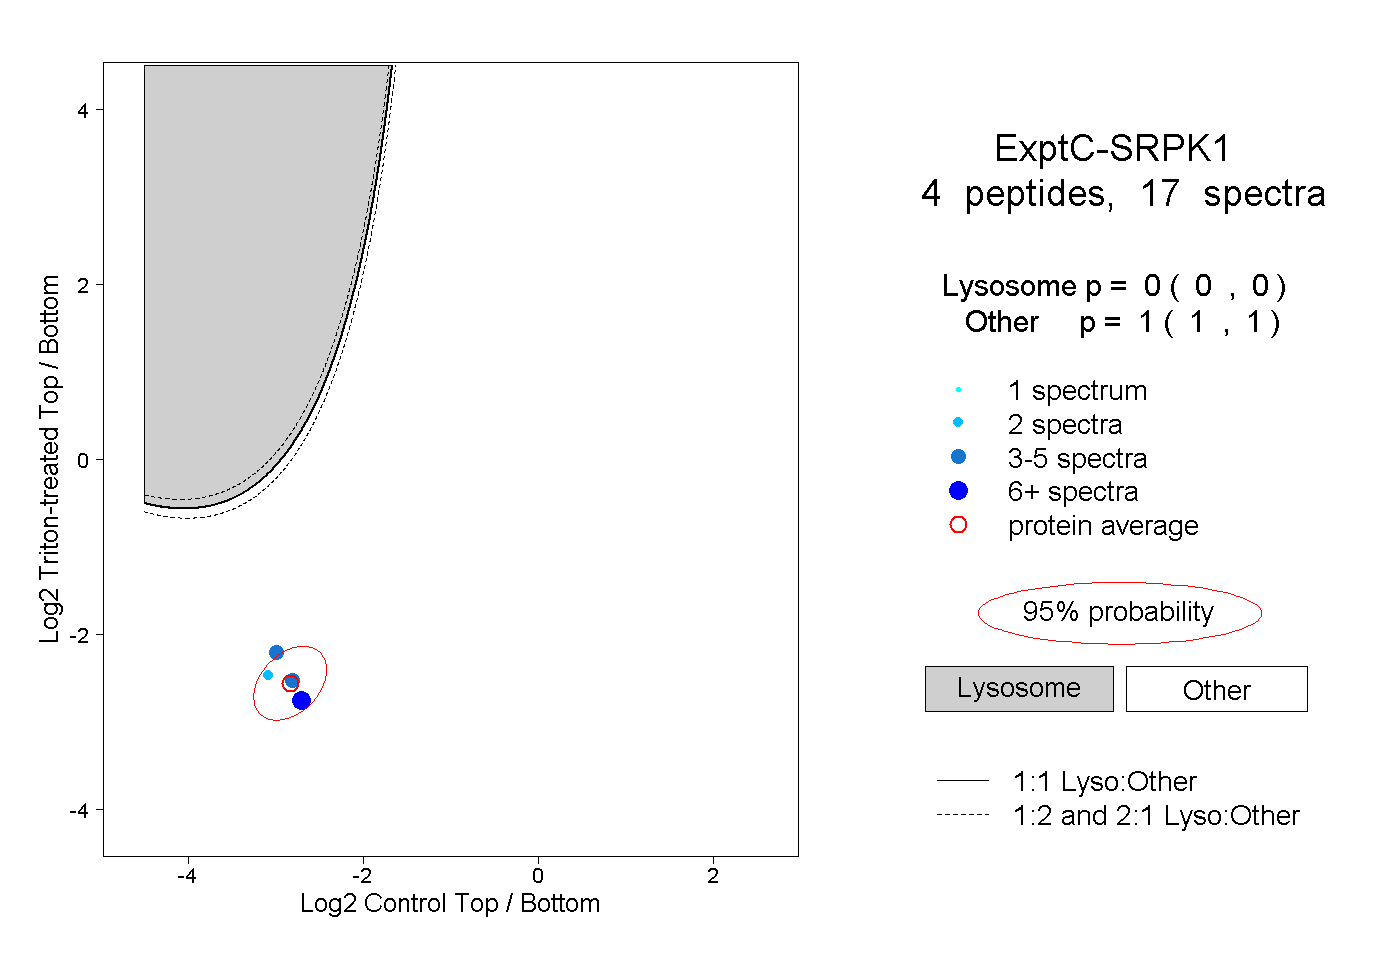
0.000 | 0.000
1.000 | 1.000
1peptide
spectra
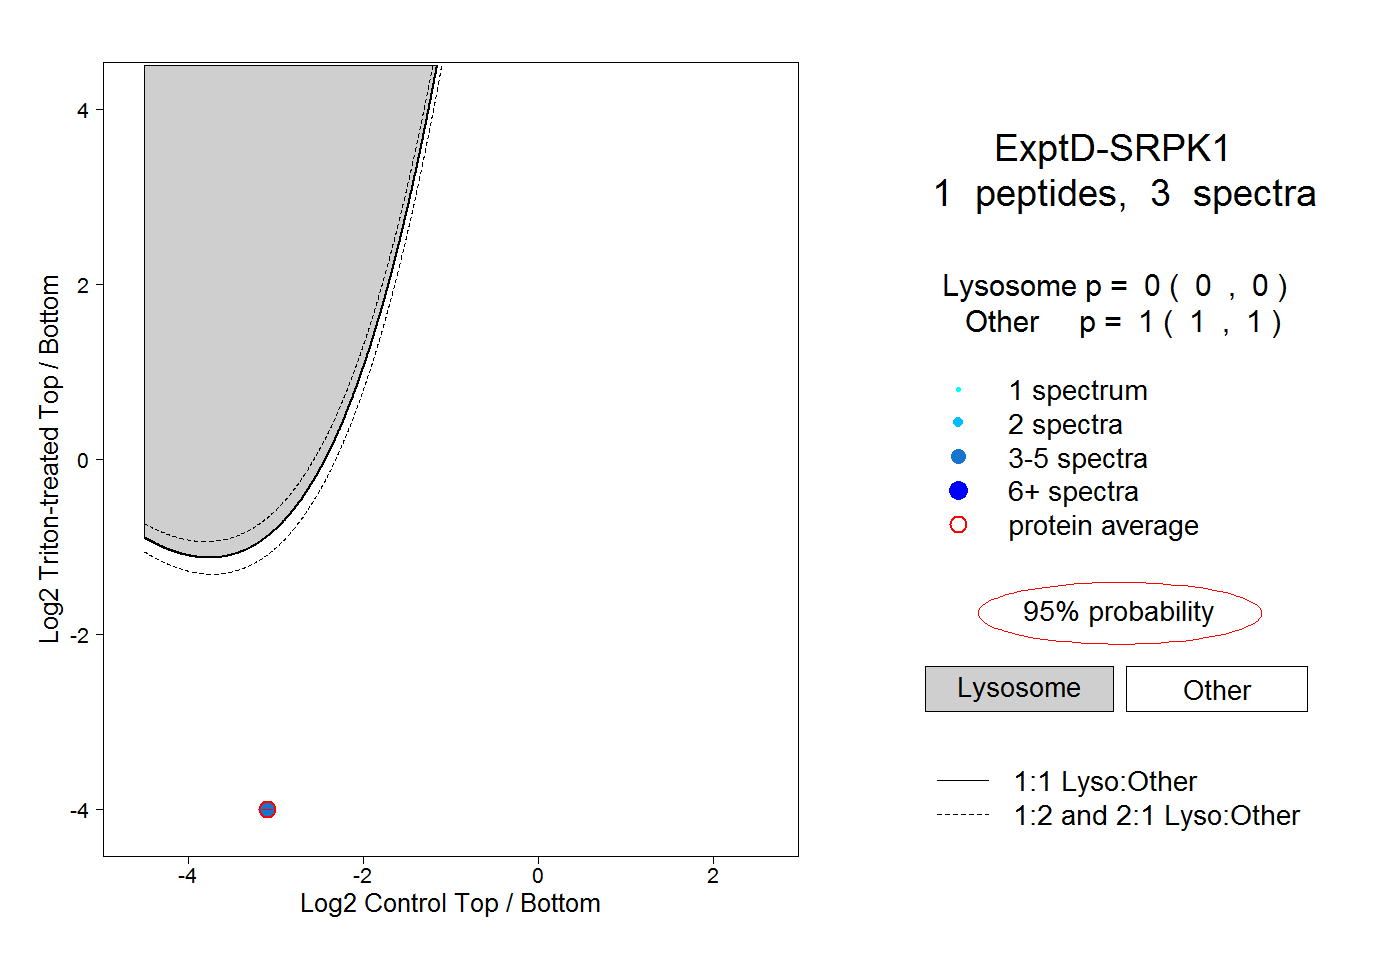
0.000 | 0.000
1.000 | 1.000