 7
7peptides
spectra
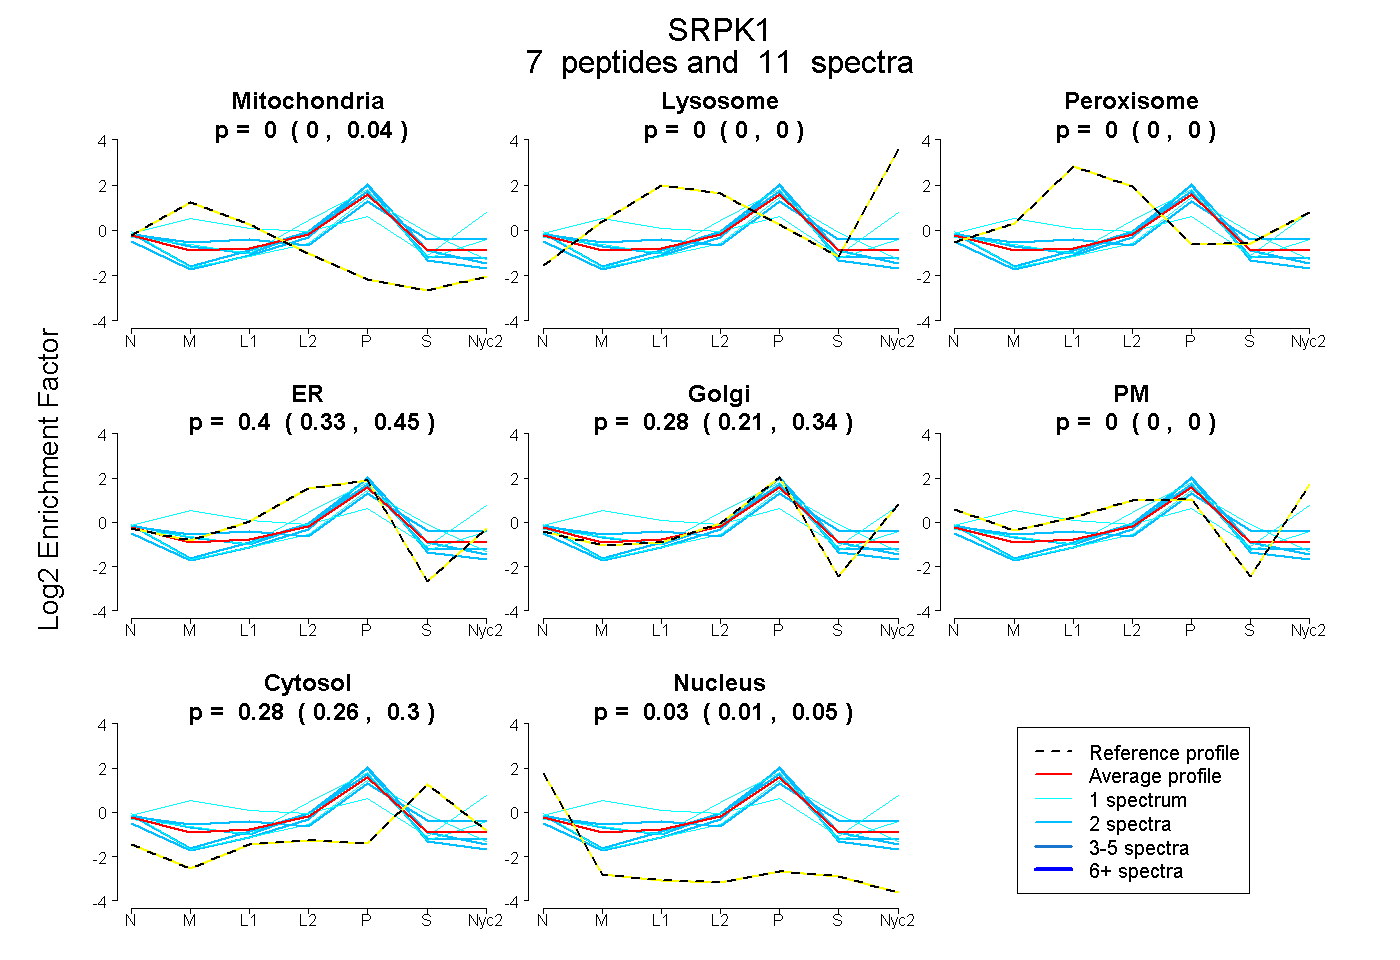
0.000 | 0.036
0.000 | 0.000
0.000 | 0.000
0.329 | 0.447
0.208 | 0.345
0.000 | 0.000
0.259 | 0.299
0.007 | 0.050
| Plot | Mito | Lyso | Perox | ER | Golgi | PM | Cytosol | Nucleus | |||||
| Expt A |
7 peptides |
11 spectra |
|
0.005 0.000 | 0.036 |
0.000 0.000 | 0.000 |
0.000 0.000 | 0.000 |
0.403 0.329 | 0.447 |
0.276 0.208 | 0.345 |
0.000 0.000 | 0.000 |
0.281 0.259 | 0.299 |
0.034 0.007 | 0.050 |
| 2 spectra, ATAAECLR | 0.000 | 0.000 | 0.000 | 0.603 | 0.079 | 0.000 | 0.190 | 0.129 | ||
| 1 spectrum, SNYQGLPLPCVK | 0.200 | 0.180 | 0.060 | 0.000 | 0.280 | 0.187 | 0.092 | 0.000 | ||
| 2 spectra, LAAEATEWQR | 0.000 | 0.000 | 0.000 | 0.387 | 0.252 | 0.000 | 0.290 | 0.071 | ||
| 1 spectrum, QAELLEK | 0.000 | 0.000 | 0.000 | 0.302 | 0.204 | 0.000 | 0.431 | 0.062 | ||
| 2 spectra, KPETQHR | 0.001 | 0.000 | 0.000 | 0.504 | 0.203 | 0.000 | 0.207 | 0.086 | ||
| 2 spectra, SLTLTQQDITHLQER | 0.074 | 0.000 | 0.099 | 0.020 | 0.520 | 0.000 | 0.288 | 0.000 | ||
| 1 spectrum, MQEIEEMEK | 0.000 | 0.000 | 0.000 | 0.452 | 0.351 | 0.000 | 0.197 | 0.000 |
| Plot | Mito | Lyso or Perox | ER | Golgi | PM | Cytosol | Nucleus | ||||||
| Expt B |
1 peptide |
1 spectrum |
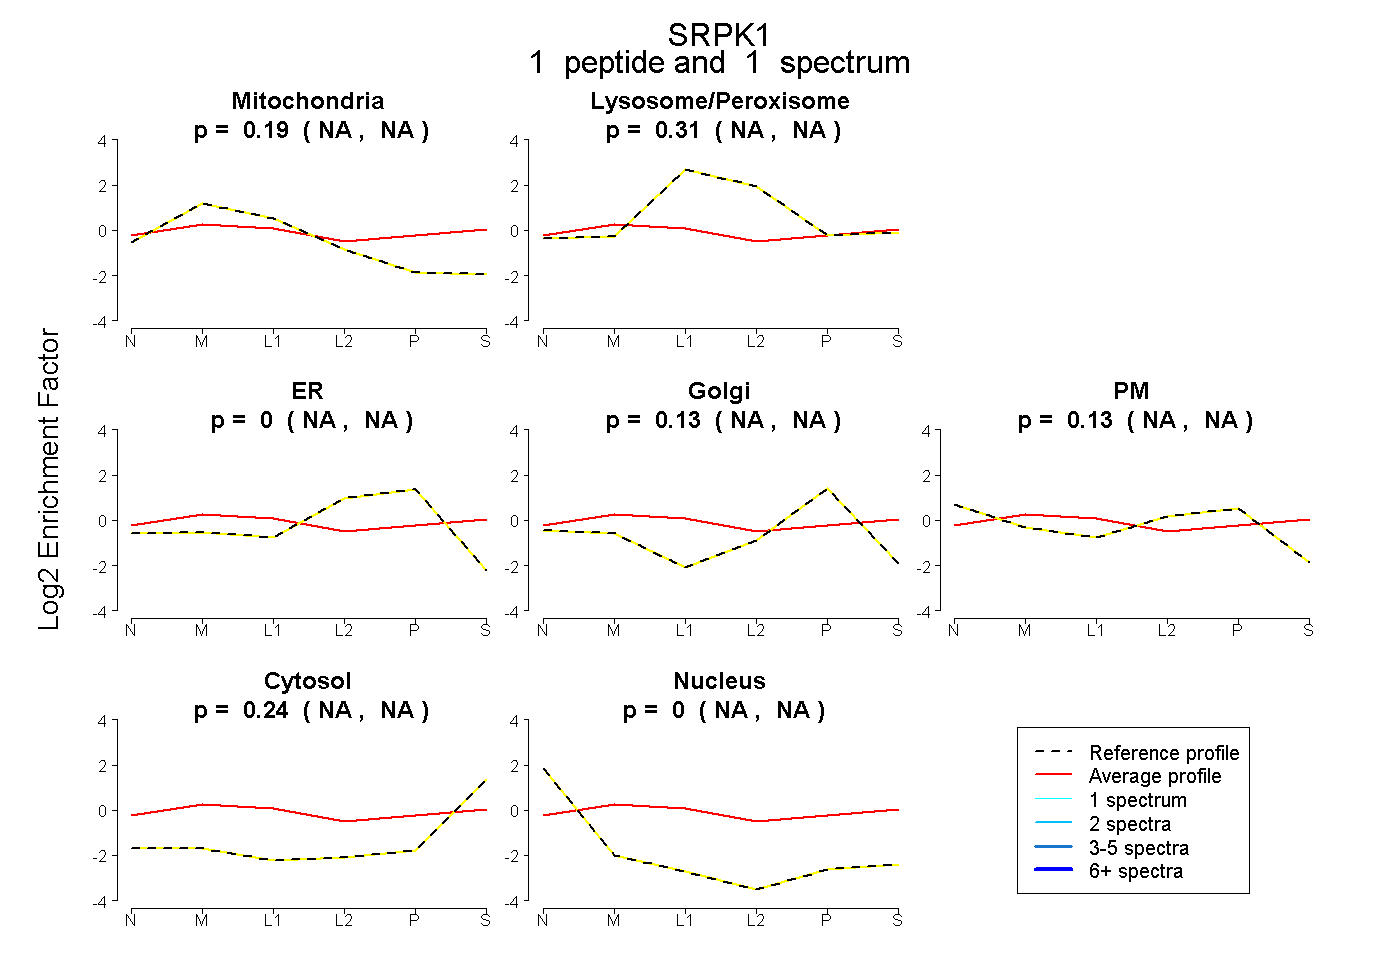 |
0.189 NA | NA |
0.307 NA | NA |
0.000 NA | NA |
0.131 NA | NA |
0.129 NA | NA |
0.243 NA | NA |
0.000 NA | NA |
|||
| Plot | Lyso | Other | |||||||||||
| Expt C |
4 peptides |
17 spectra |
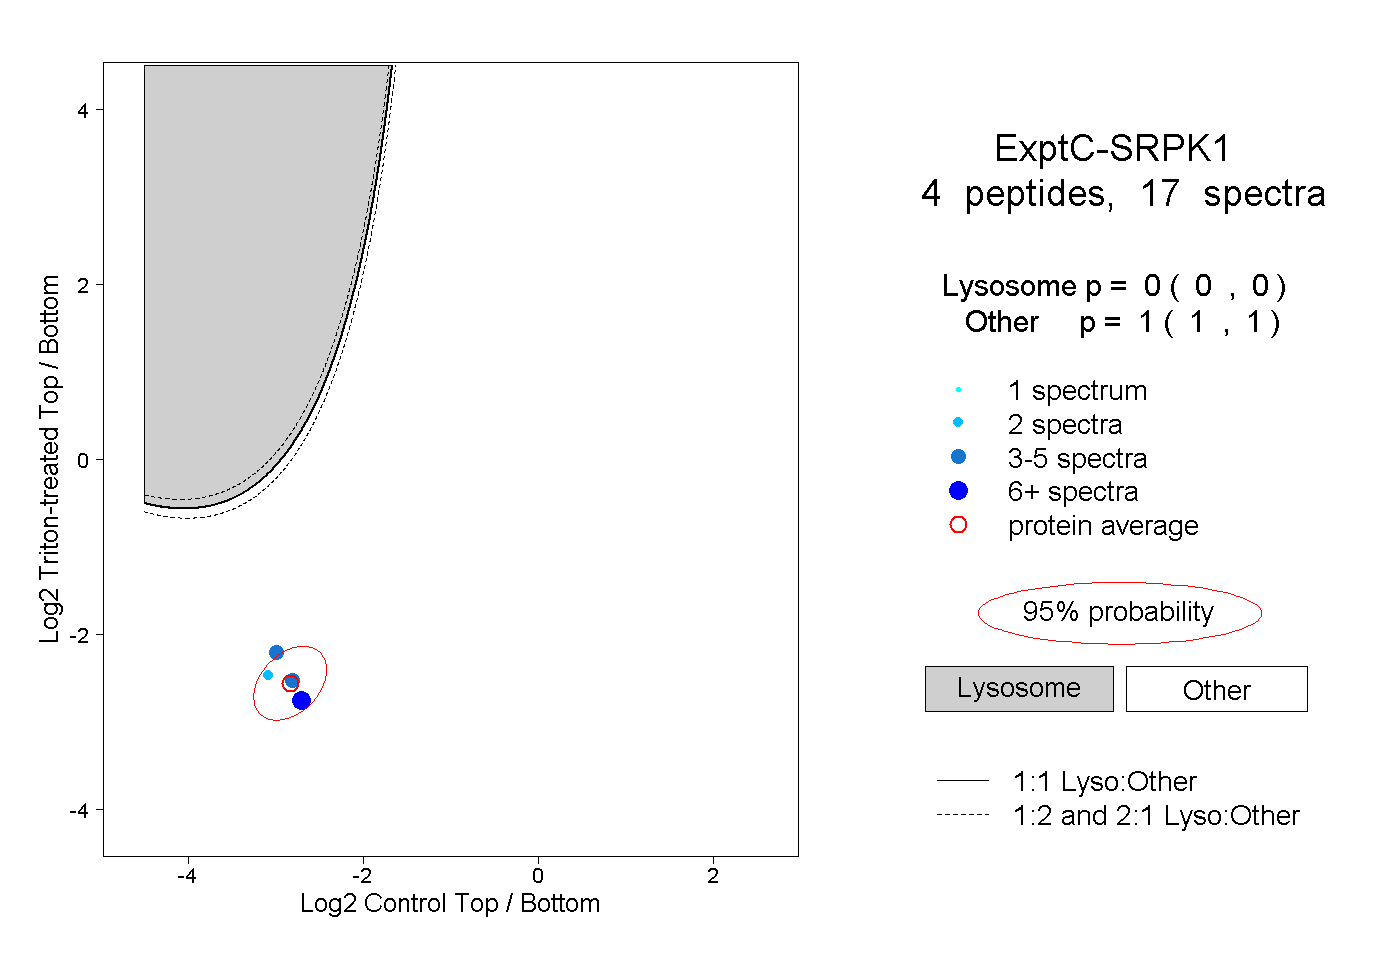 |
0.000 0.000 | 0.000 |
1.000 1.000 | 1.000 |
||||||||
| Plot | Lyso | Other | |||||||||||
| Expt D |
1 peptide |
3 spectra |
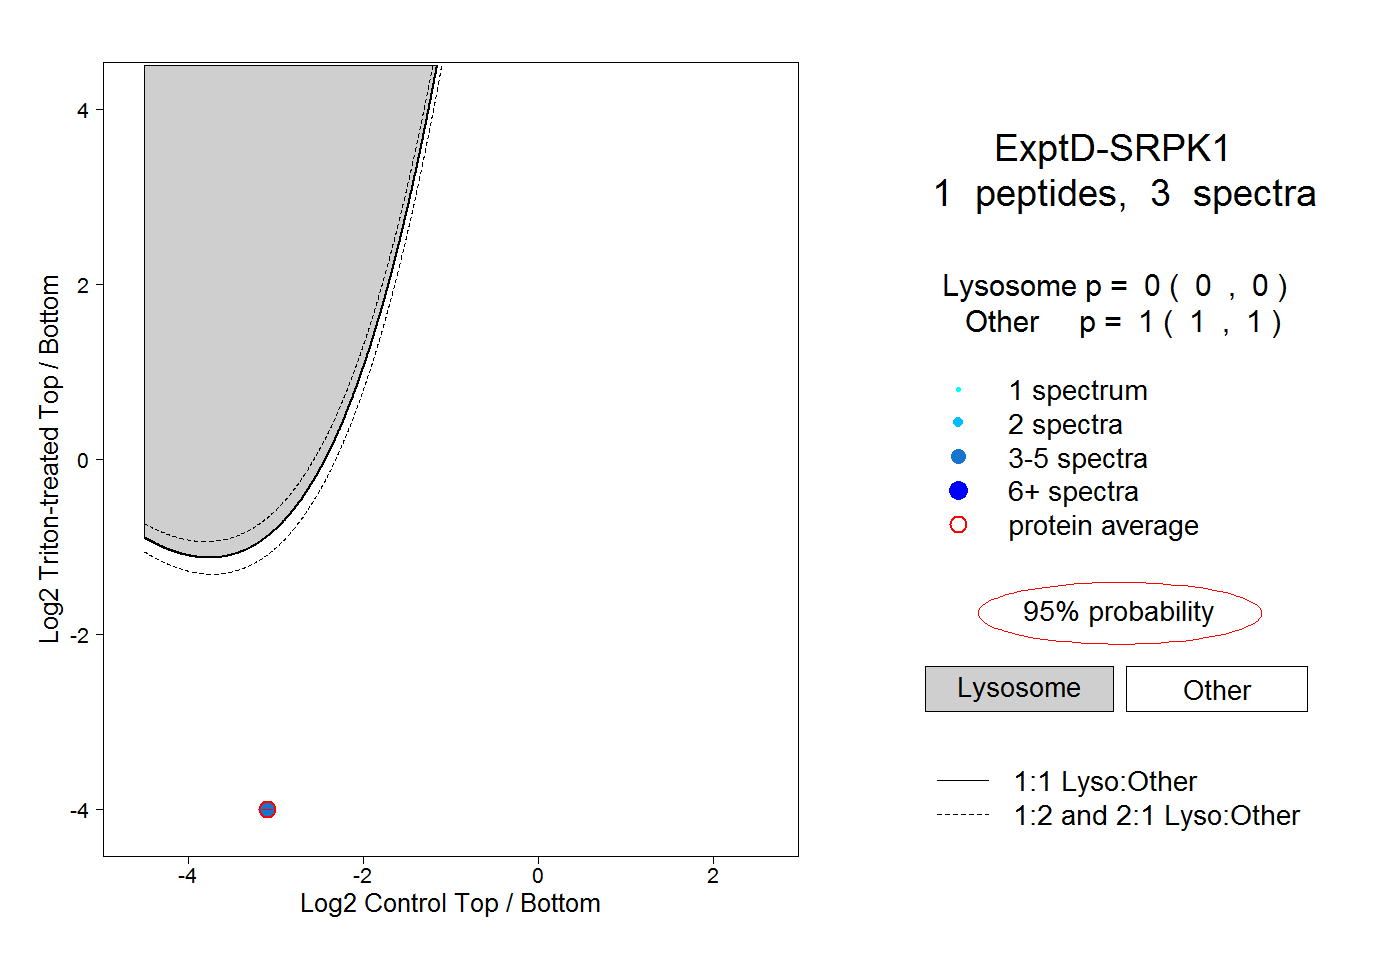 |
0.000 0.000 | 0.000 |
1.000 1.000 | 1.000 |