 6
6peptides
spectra
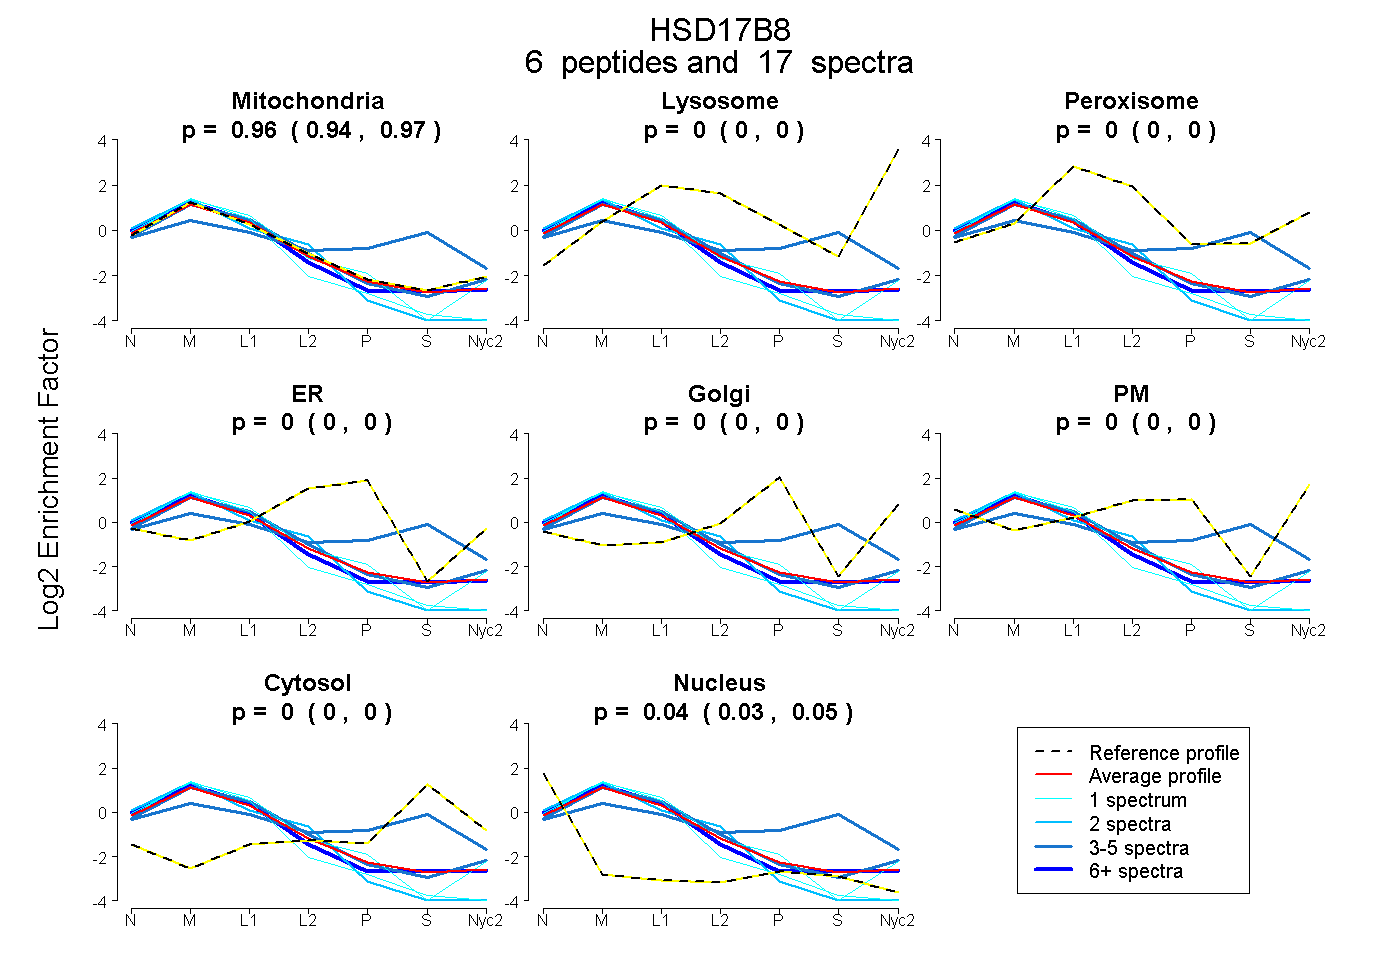
0.944 | 0.967
0.000 | 0.000
0.000 | 0.000
0.000 | 0.000
0.000 | 0.000
0.000 | 0.000
0.000 | 0.000
0.031 | 0.054
4peptides
spectra
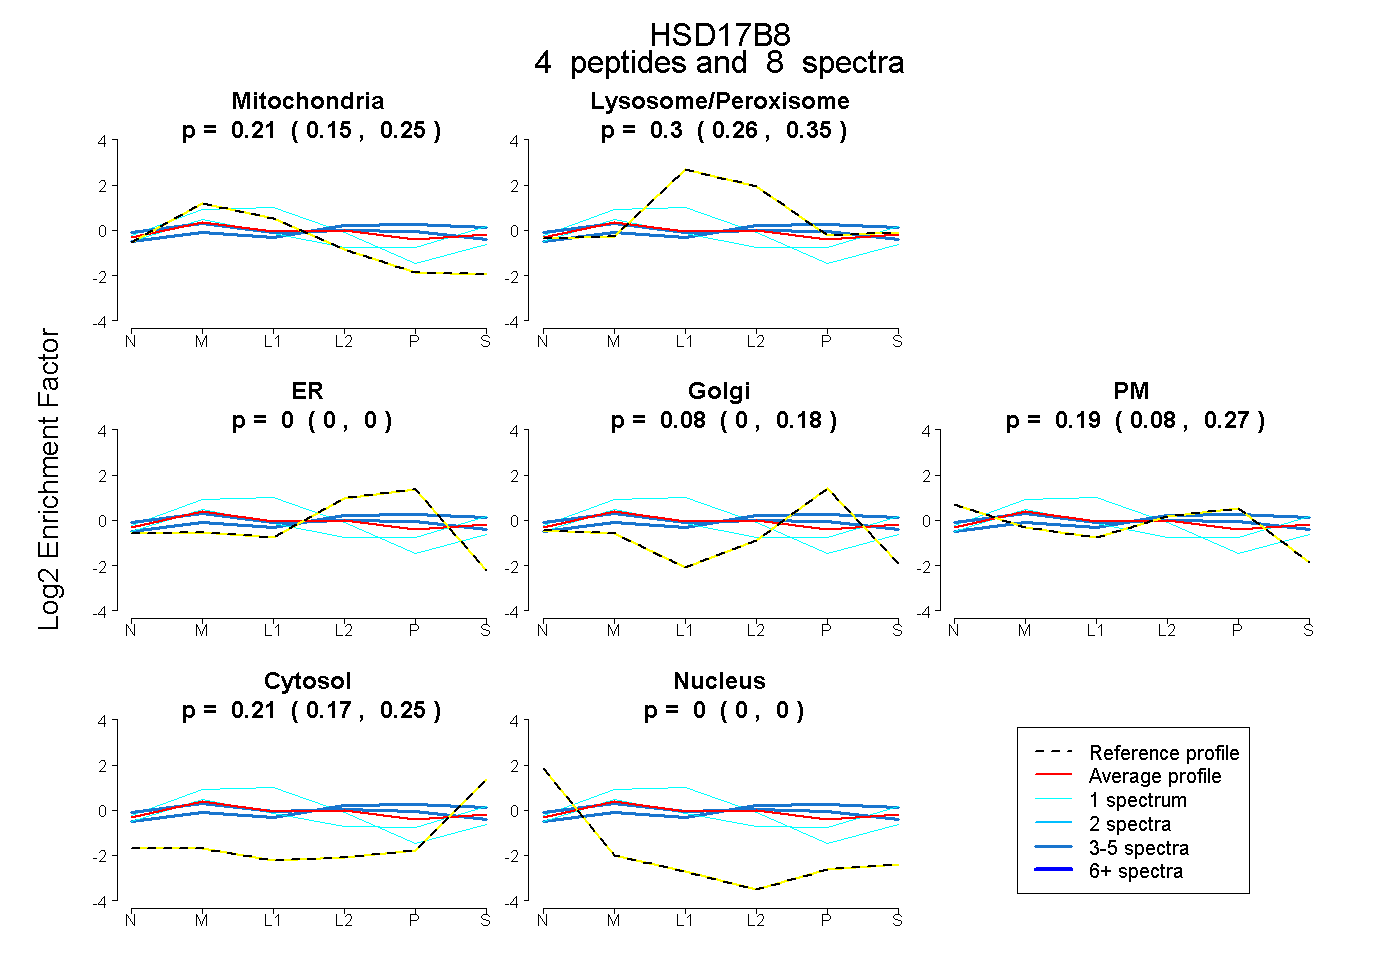
0.154 | 0.255
0.260 | 0.347
0.000 | 0.000
0.000 | 0.179
0.085 | 0.266
0.169 | 0.247
0.000 | 0.000
8peptides
spectra
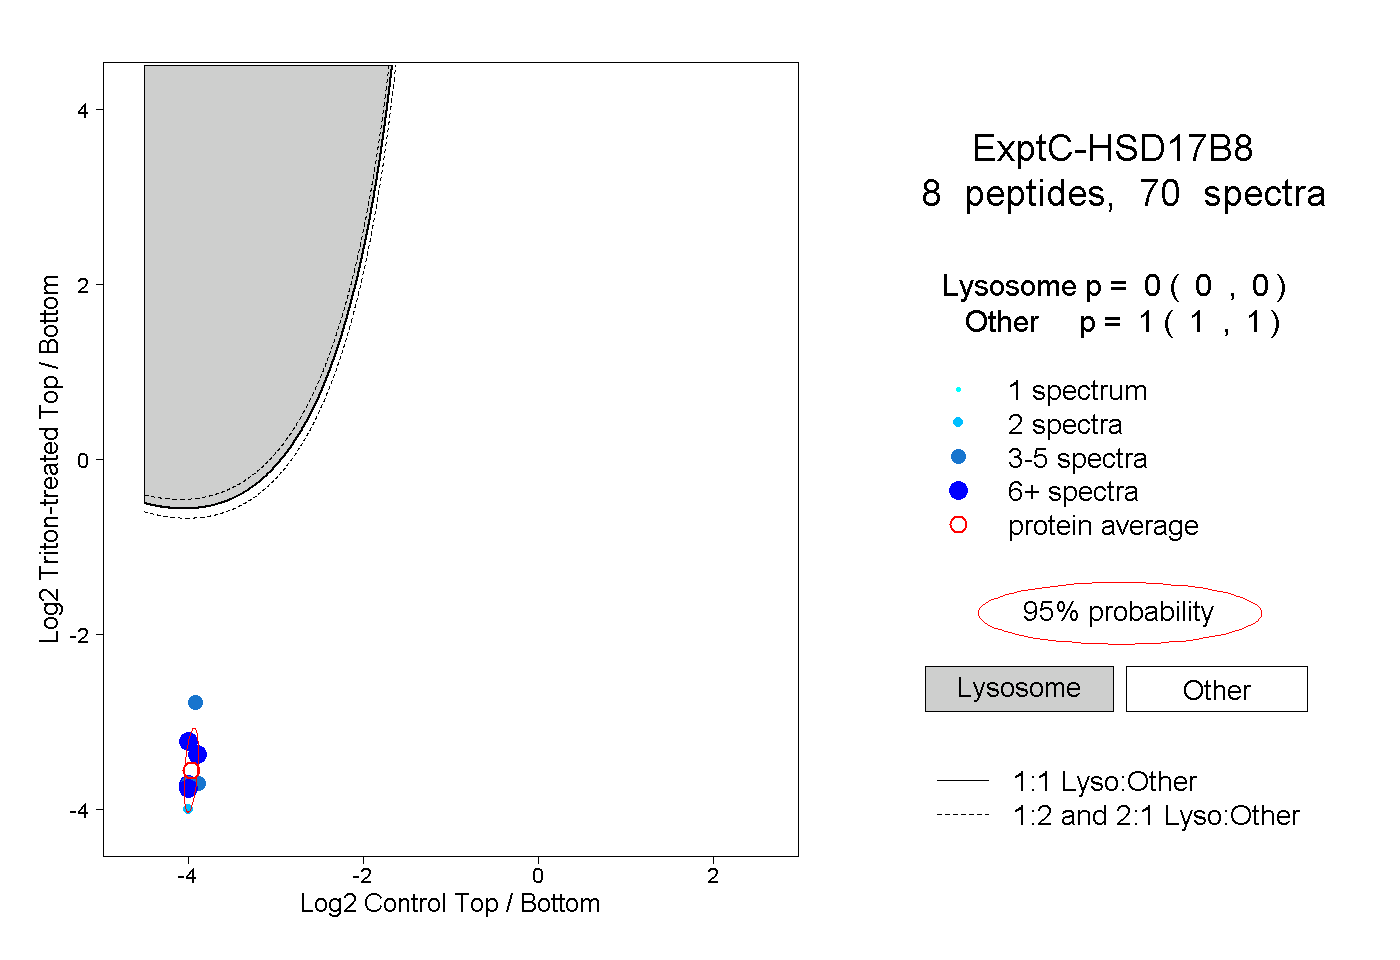
0.000 | 0.000
1.000 | 1.000
2peptides
spectra
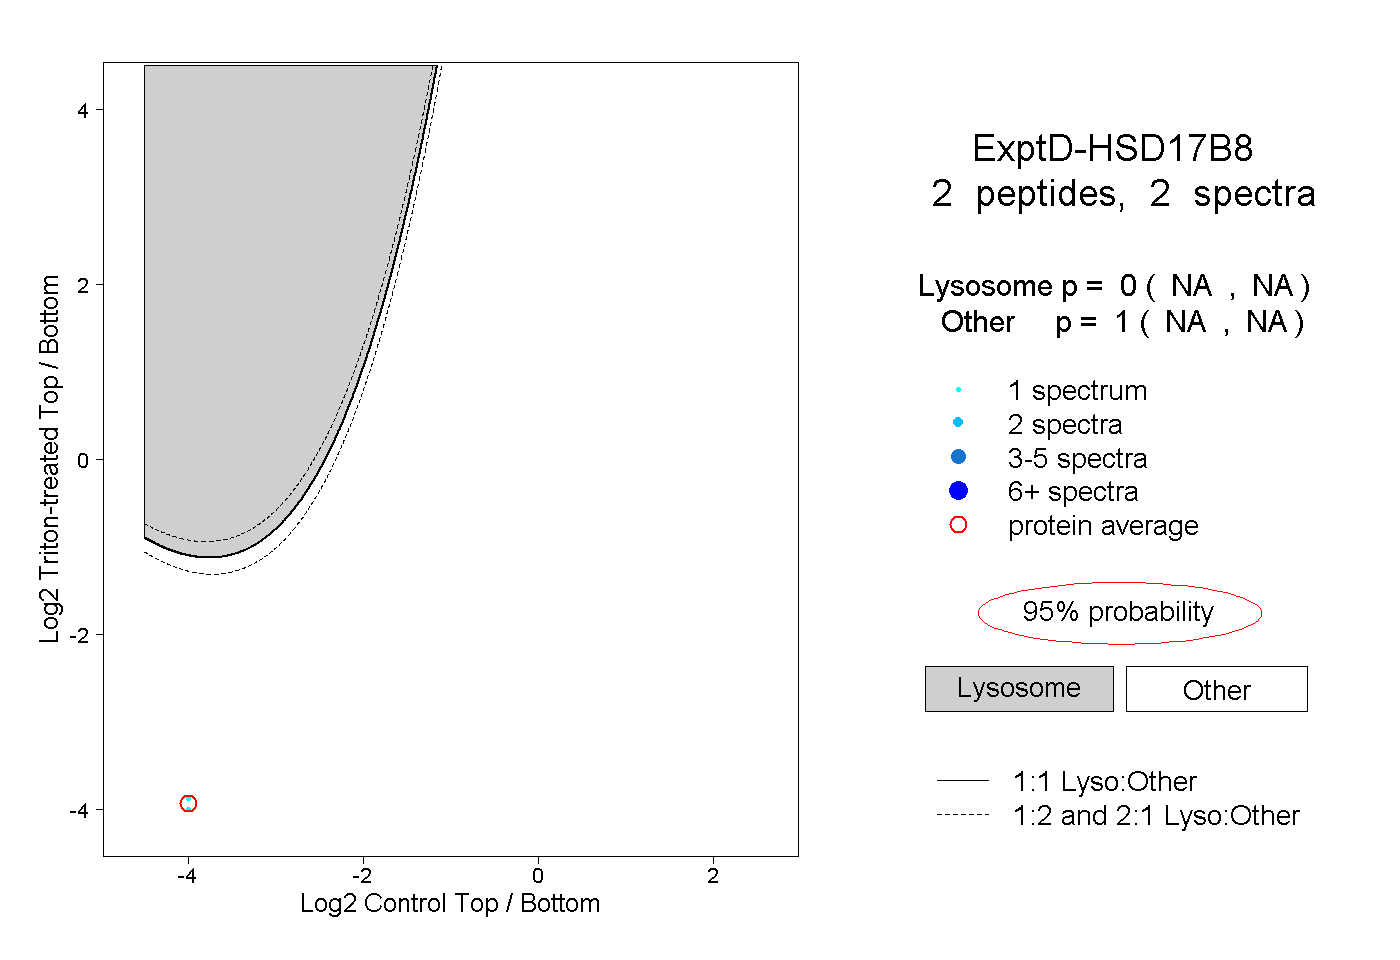
NA | NA
NA | NA