 6
6peptides
spectra
0.944 | 0.967
0.000 | 0.000
0.000 | 0.000
0.000 | 0.000
0.000 | 0.000
0.000 | 0.000
0.000 | 0.000
0.031 | 0.054
| Plot | Mito | Lyso | Perox | ER | Golgi | PM | Cytosol | Nucleus | |||||
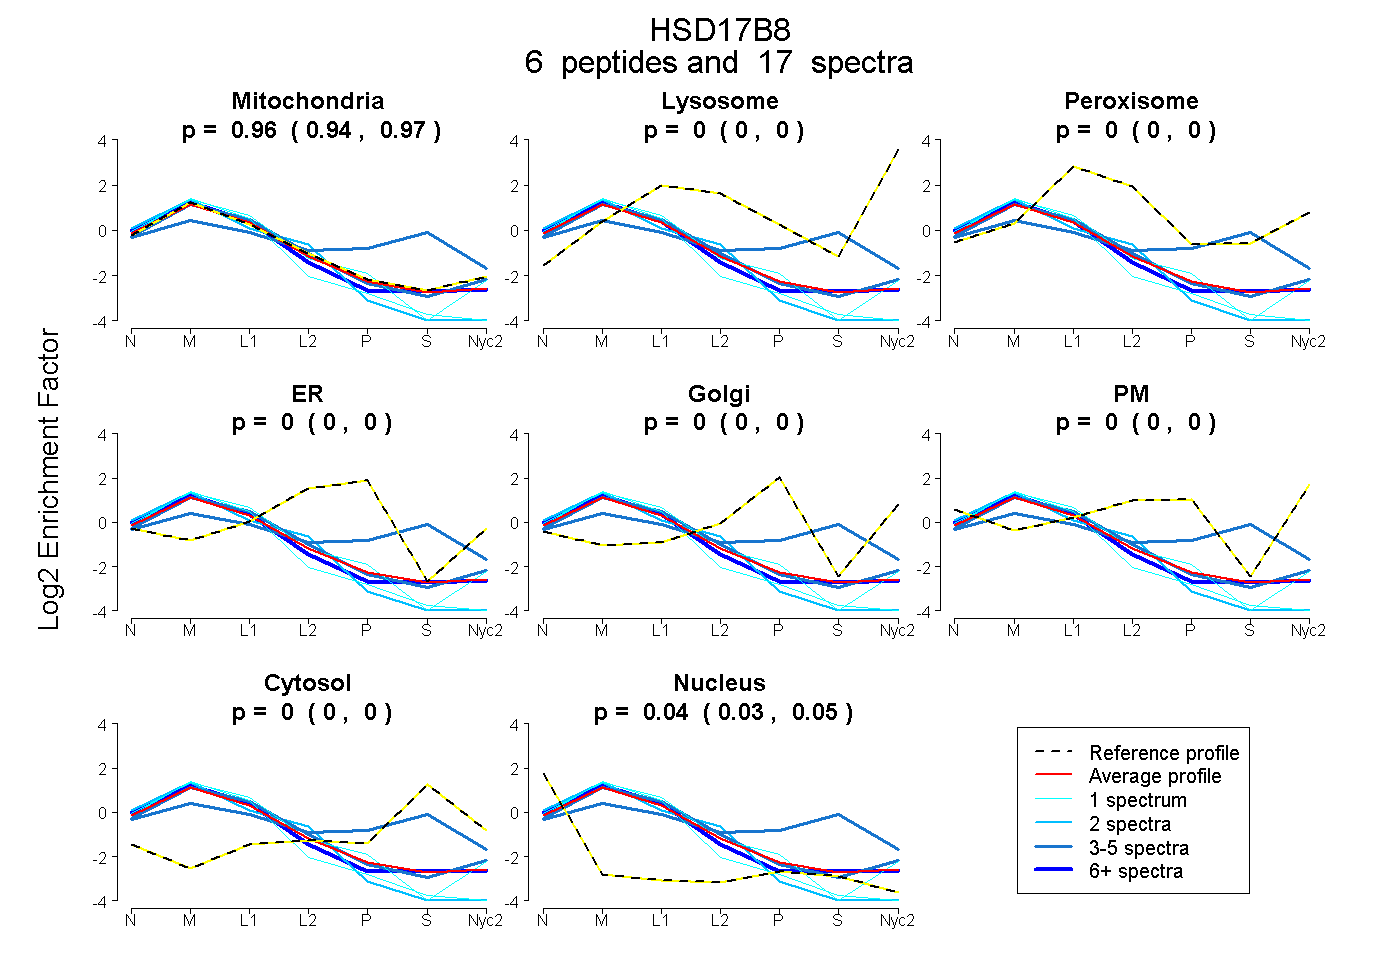
| Expt A |
6 peptides |
17 spectra |
|
0.956 0.944 | 0.967 |
0.000 0.000 | 0.000 |
0.000 0.000 | 0.000 |
0.000 0.000 | 0.000 |
0.000 0.000 | 0.000 |
0.000 0.000 | 0.000 |
0.000 0.000 | 0.000 |
0.044 0.031 | 0.054 |
| 1 spectrum, VGNIGQTNYASSK | 0.999 | 0.000 | 0.000 | 0.001 | 0.000 | 0.000 | 0.000 | 0.000 | ||
| 3 spectra, HAAFQADVSEGPAAK | 0.472 | 0.000 | 0.117 | 0.038 | 0.000 | 0.000 | 0.373 | 0.000 | ||
| 1 spectrum, SALALVTGAGSGIGR | 0.881 | 0.000 | 0.000 | 0.000 | 0.000 | 0.000 | 0.000 | 0.119 | ||
| 6 spectra, AGVIGLTQTAAR | 0.942 | 0.000 | 0.000 | 0.000 | 0.000 | 0.000 | 0.000 | 0.058 | ||
| 2 spectra, CNSVLPGFIATPMTQK | 0.900 | 0.000 | 0.000 | 0.000 | 0.000 | 0.000 | 0.000 | 0.100 | ||
| 4 spectra, GSIINISSIVGK | 1.000 | 0.000 | 0.000 | 0.000 | 0.000 | 0.000 | 0.000 | 0.000 |
| Plot | Mito | Lyso or Perox | ER | Golgi | PM | Cytosol | Nucleus | ||||||
| Expt B |
4 peptides |
8 spectra |
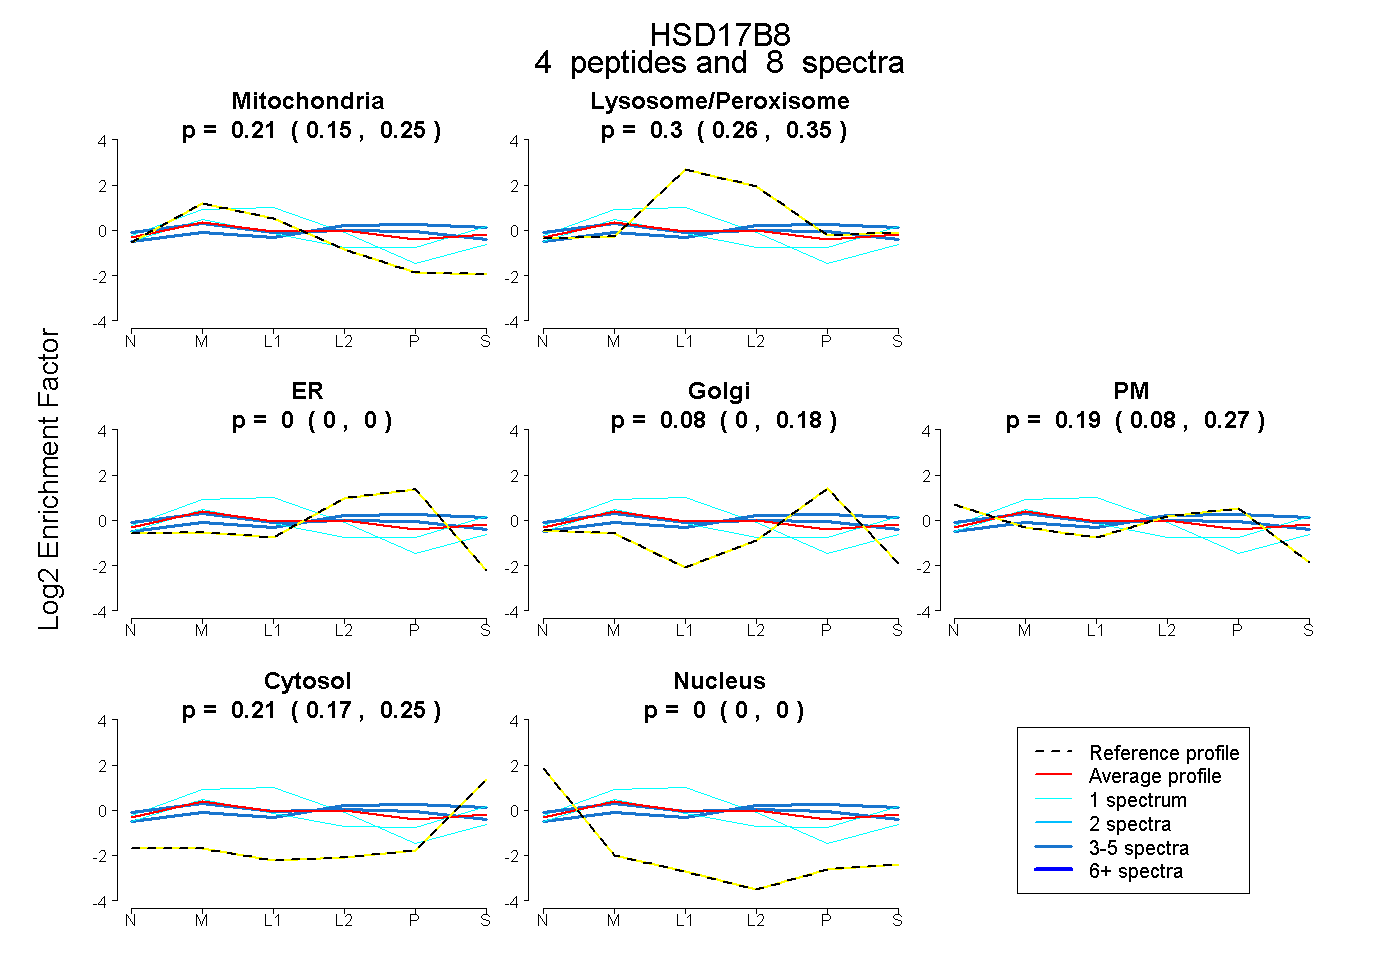 |
0.208 0.154 | 0.255 |
0.305 0.260 | 0.347 |
0.000 0.000 | 0.000 |
0.080 0.000 | 0.179 |
0.194 0.085 | 0.266 |
0.213 0.169 | 0.247 |
0.000 0.000 | 0.000 |
|||
| Plot | Lyso | Other | |||||||||||
| Expt C |
8 peptides |
70 spectra |
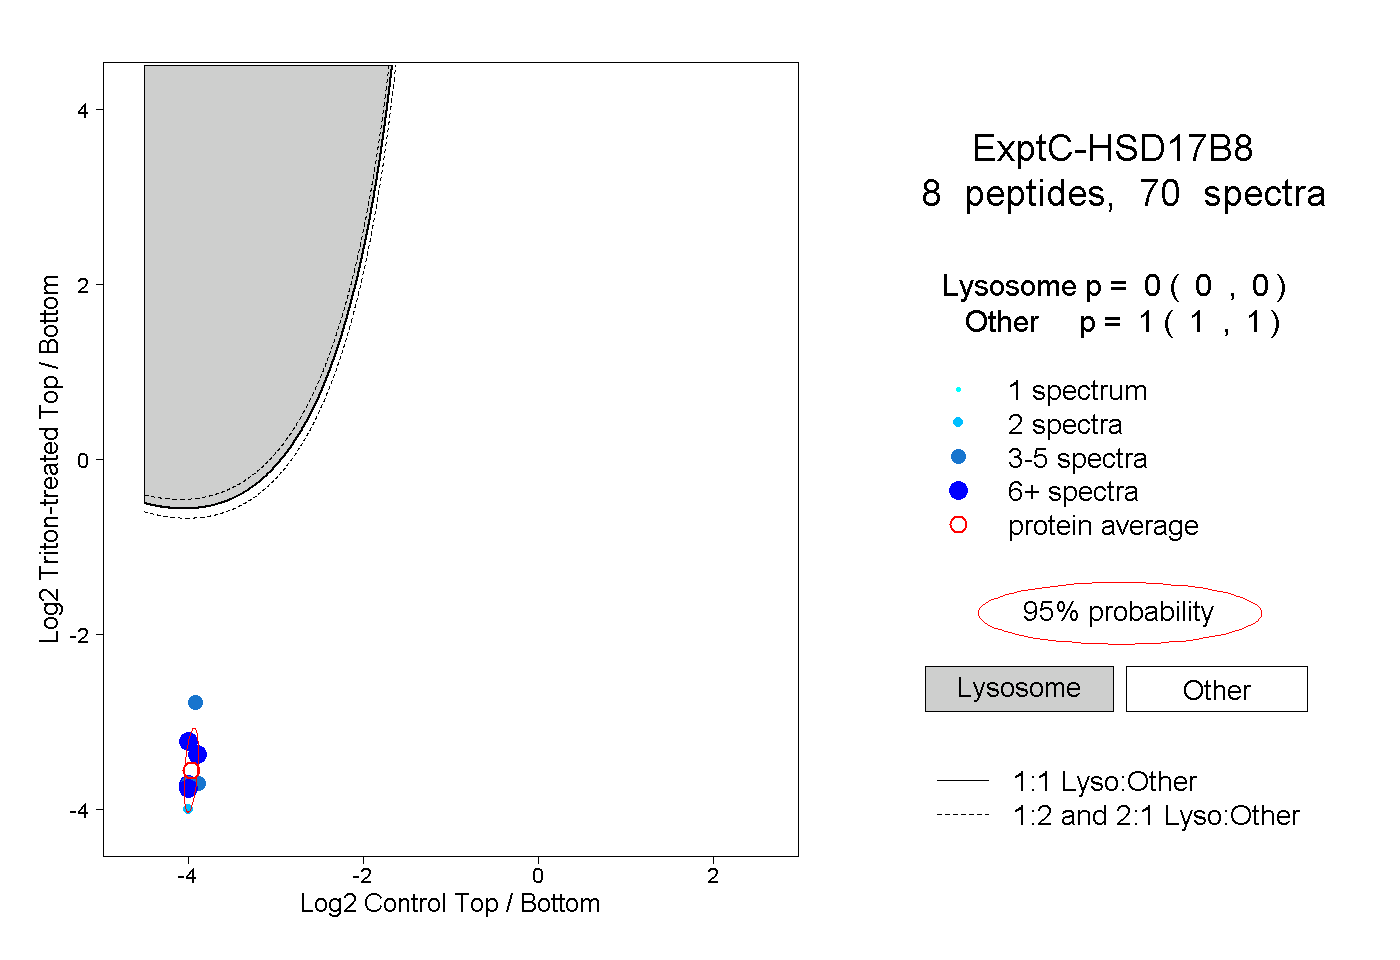 |
0.000 0.000 | 0.000 |
1.000 1.000 | 1.000 |
||||||||
| Plot | Lyso | Other | |||||||||||
| Expt D |
2 peptides |
2 spectra |
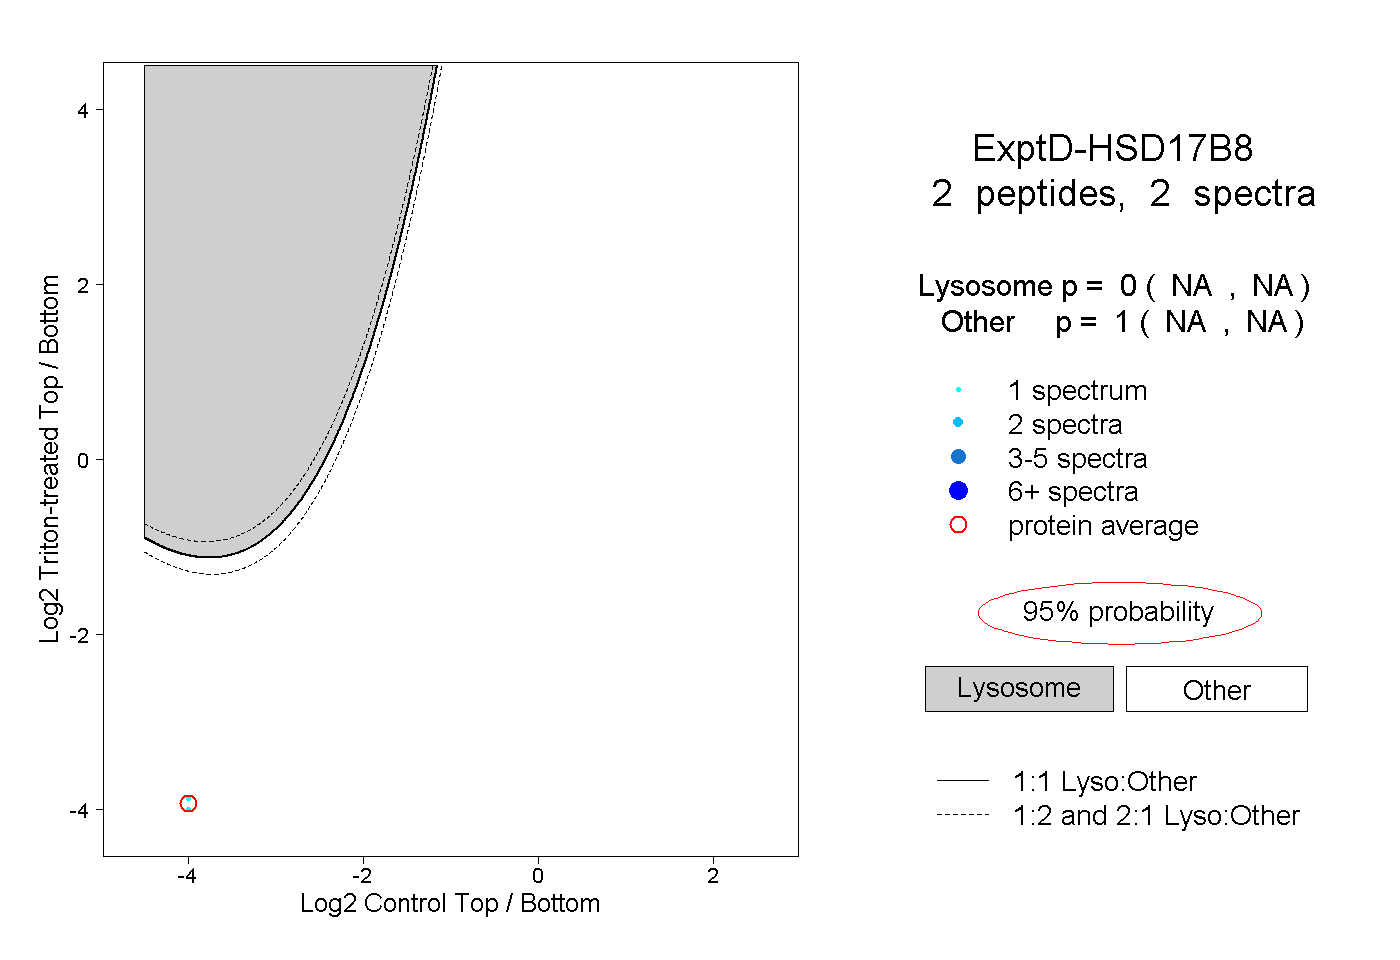 |
0.000 NA | NA |
1.000 NA | NA |