 9
9peptides
spectra
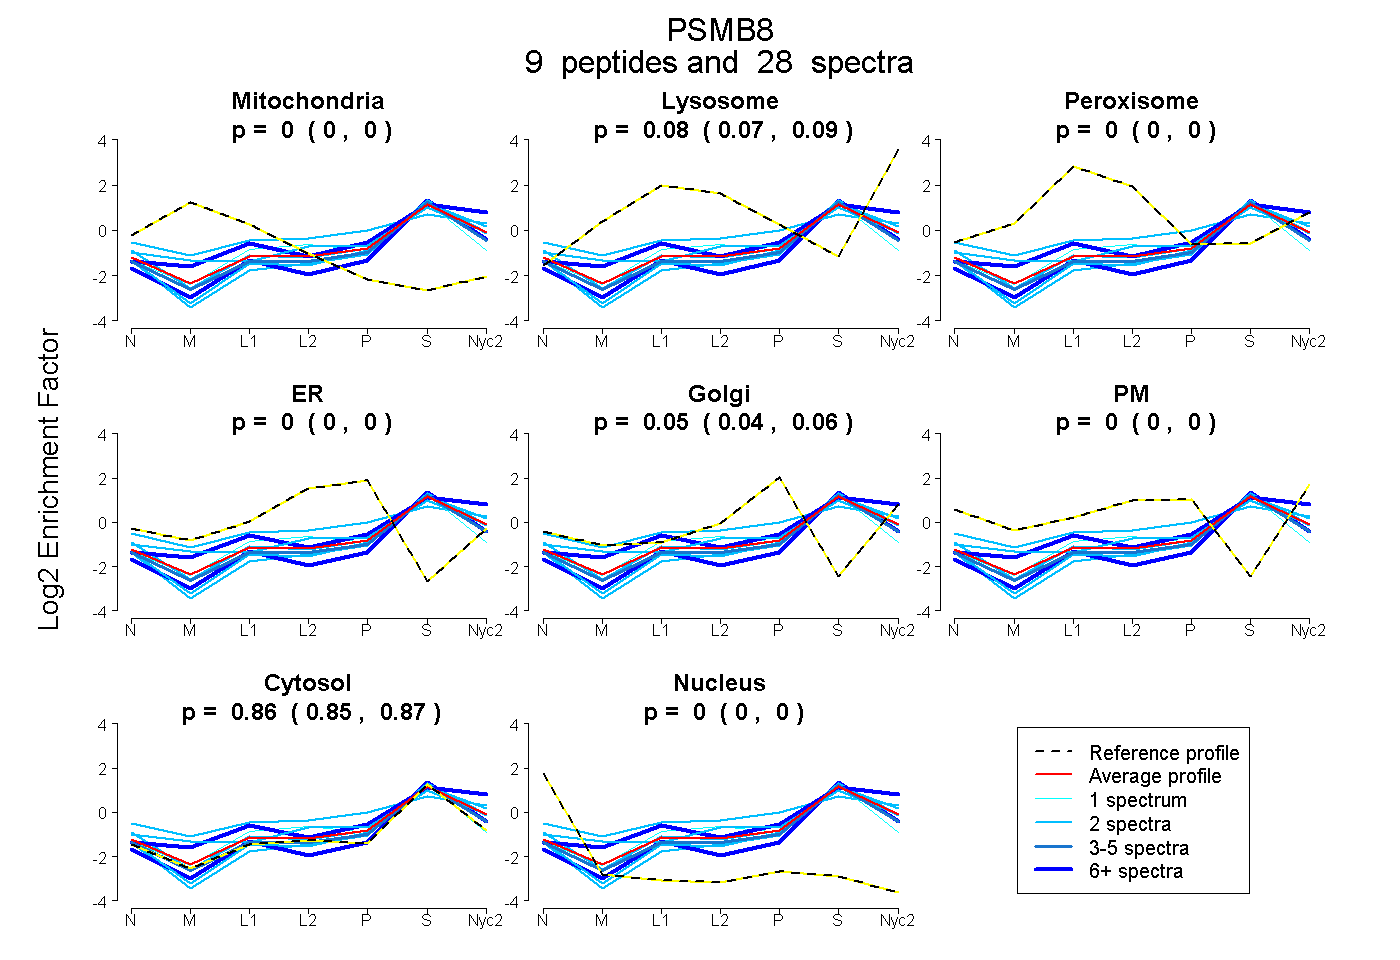
0.000 | 0.000
0.072 | 0.094
0.000 | 0.000
0.000 | 0.000
0.041 | 0.062
0.000 | 0.000
0.854 | 0.871
0.000 | 0.000
4peptides
spectra
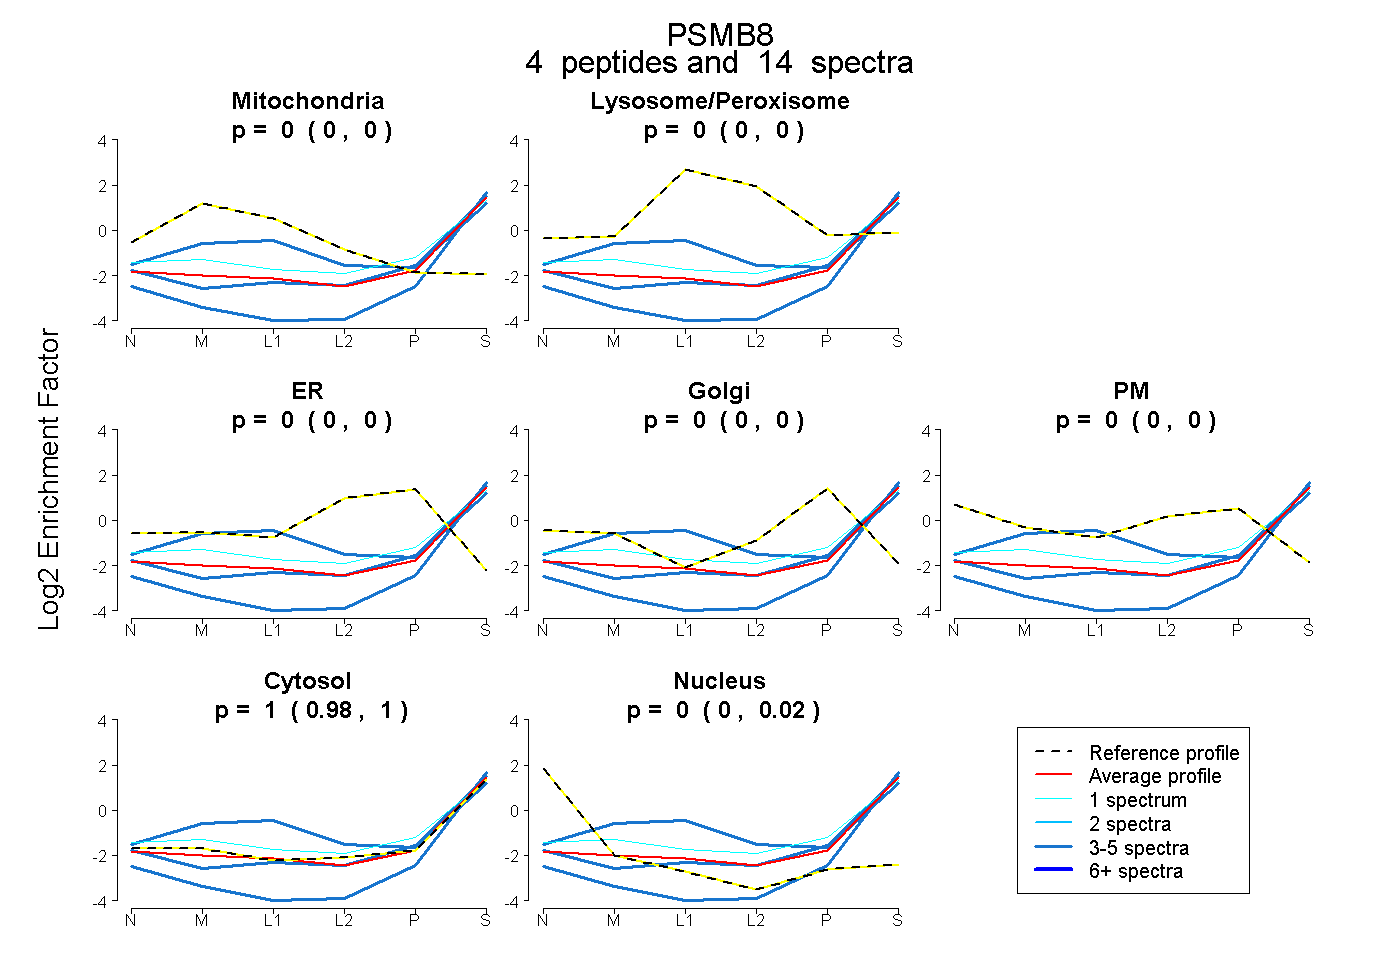
0.000 | 0.000
0.000 | 0.002
0.000 | 0.000
0.000 | 0.000
0.000 | 0.000
0.976 | 1.000
0.000 | 0.016
9peptides
spectra
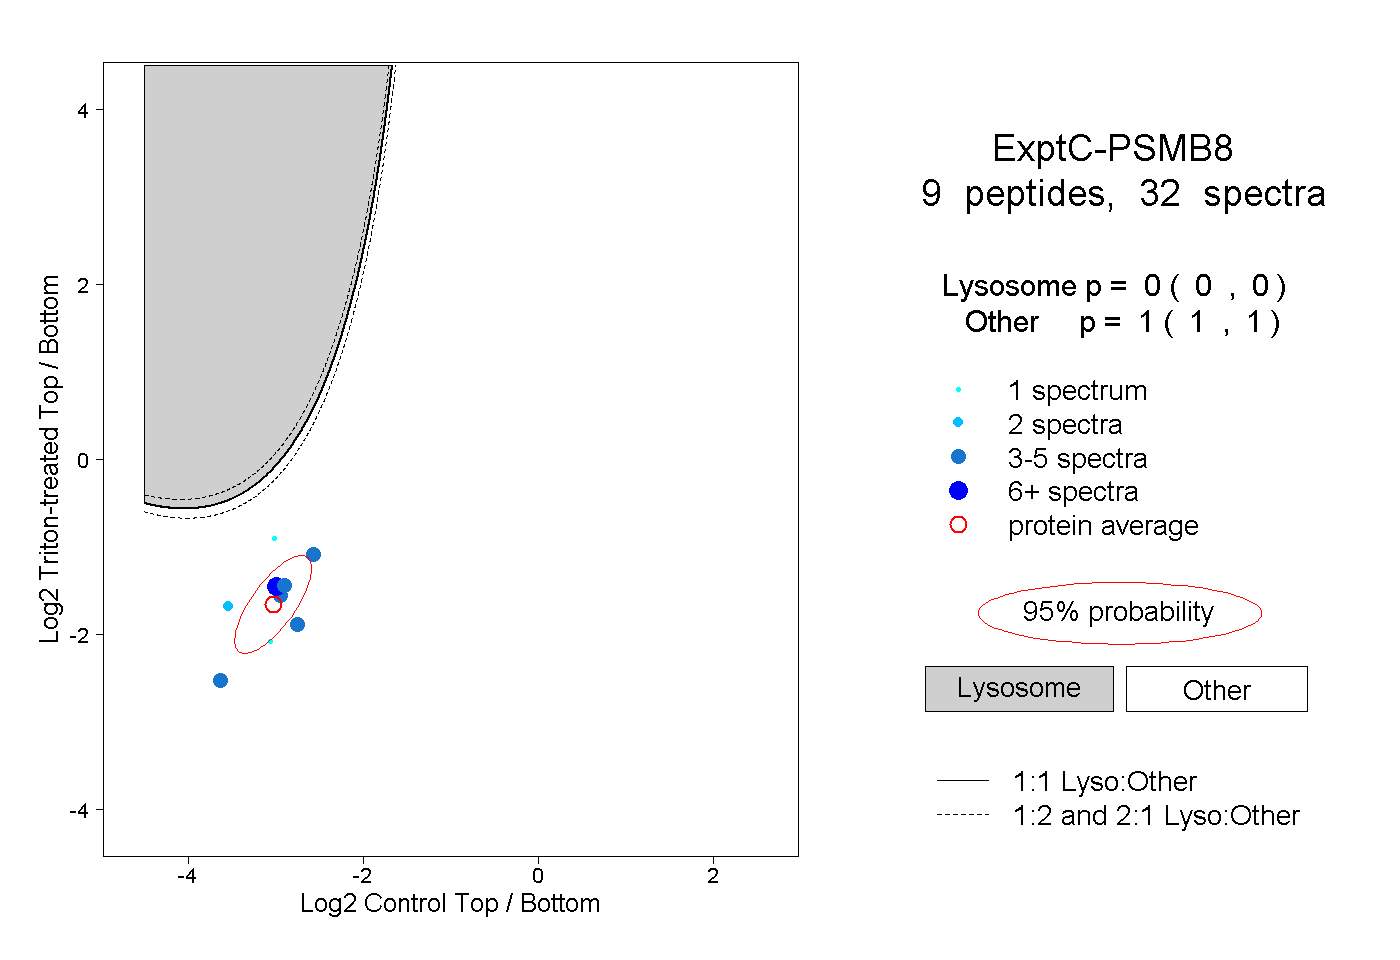
0.000 | 0.000
1.000 | 1.000
3peptides
spectra
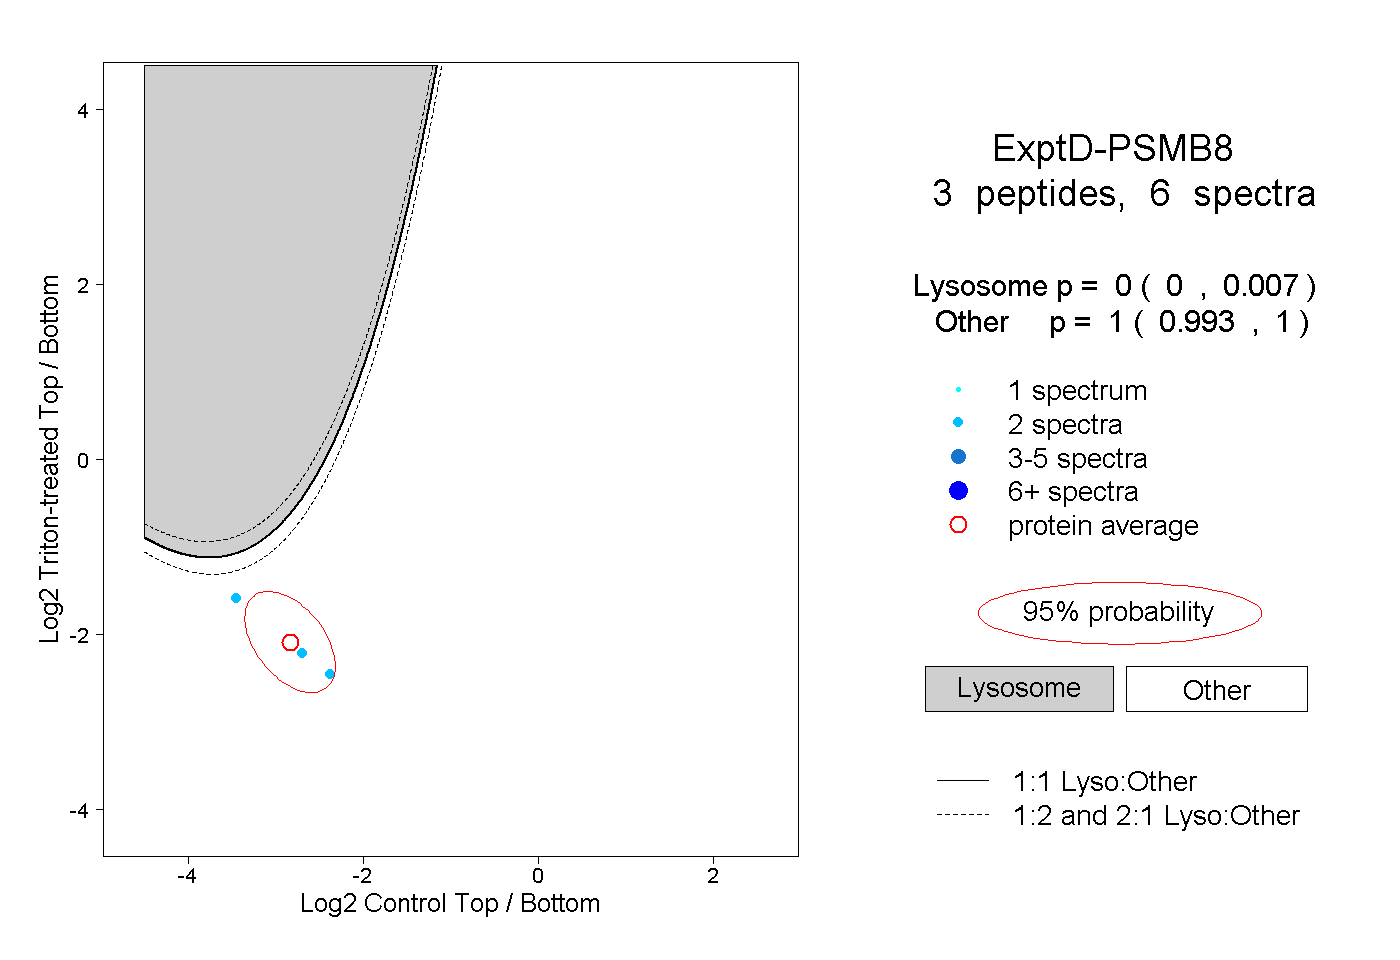
0.000 | 0.007
0.993 | 1.000