 9
9peptides
spectra
0.000 | 0.000
0.072 | 0.094
0.000 | 0.000
0.000 | 0.000
0.041 | 0.062
0.000 | 0.000
0.854 | 0.871
0.000 | 0.000
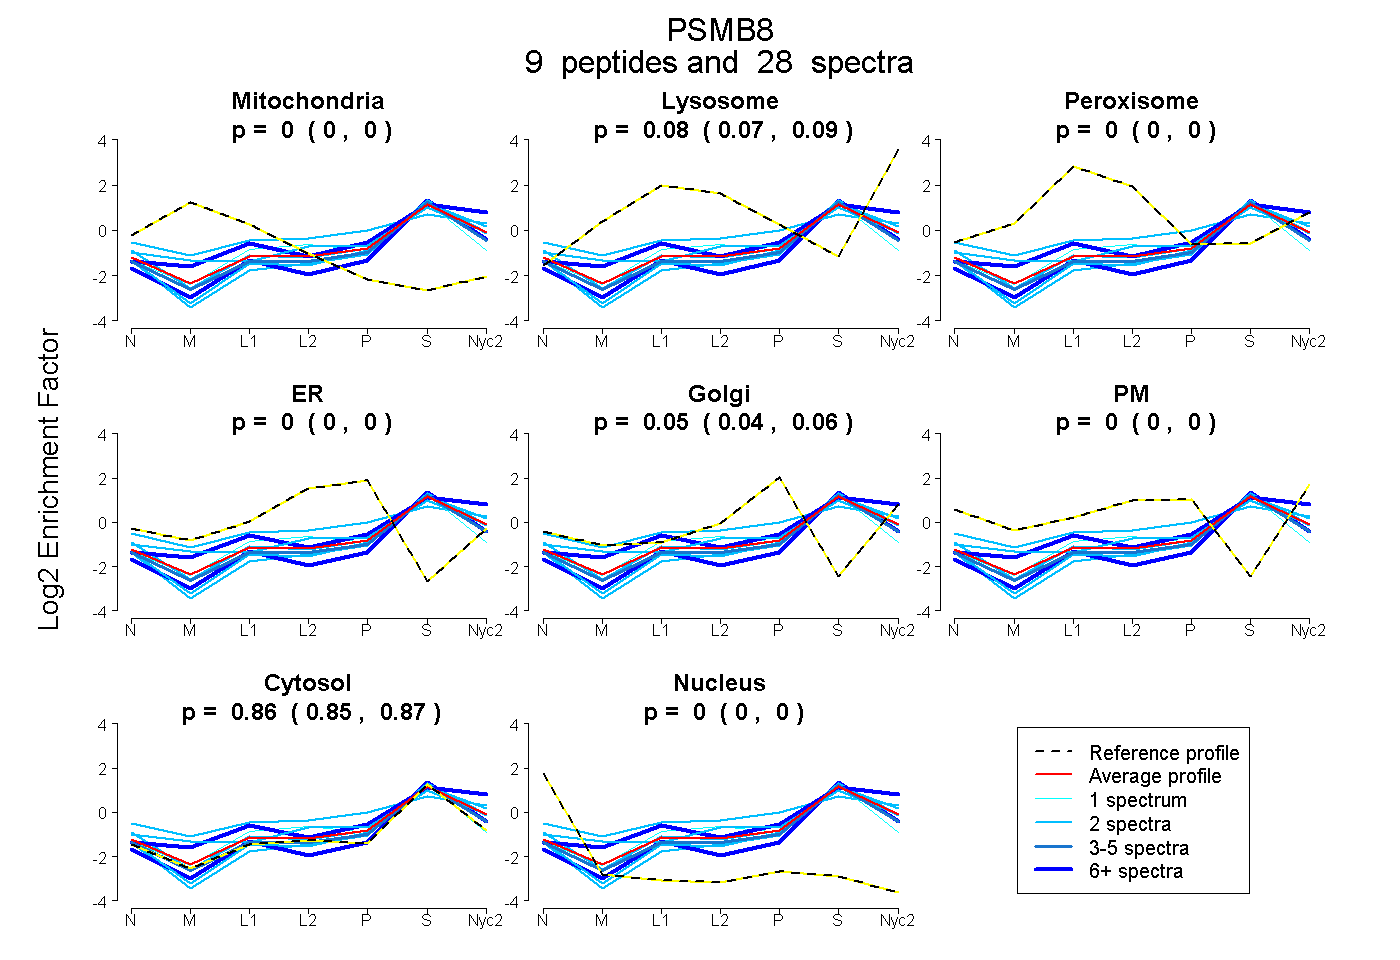
| Plot | Mito | Lyso | Perox | ER | Golgi | PM | Cytosol | Nucleus | |||||
| Expt A |
9 peptides |
28 spectra |
|
0.000 0.000 | 0.000 |
0.084 0.072 | 0.094 |
0.000 0.000 | 0.000 |
0.000 0.000 | 0.000 |
0.053 0.041 | 0.062 |
0.000 0.000 | 0.000 |
0.863 0.854 | 0.871 |
0.000 0.000 | 0.000 |
| 3 spectra, VESTDVSDLLHK | 0.000 | 0.012 | 0.000 | 0.000 | 0.050 | 0.000 | 0.937 | 0.000 | ||
| 2 spectra, AIVYATHR | 0.000 | 0.000 | 0.000 | 0.000 | 0.014 | 0.000 | 0.986 | 0.000 | ||
| 2 spectra, QDLSPEEAYDLAR | 0.001 | 0.078 | 0.000 | 0.000 | 0.024 | 0.125 | 0.771 | 0.000 | ||
| 8 spectra, LLSNMMLQYR | 0.000 | 0.264 | 0.000 | 0.000 | 0.000 | 0.000 | 0.736 | 0.000 | ||
| 2 spectra, GPGLYYVDDNGTR | 0.000 | 0.060 | 0.000 | 0.000 | 0.000 | 0.080 | 0.861 | 0.000 | ||
| 6 spectra, ASAGSYIATIR | 0.000 | 0.000 | 0.000 | 0.000 | 0.000 | 0.000 | 1.000 | 0.000 | ||
| 2 spectra, FQHGVIVAVDSR | 0.000 | 0.067 | 0.118 | 0.000 | 0.066 | 0.176 | 0.572 | 0.000 | ||
| 2 spectra, ISVSAASK | 0.000 | 0.000 | 0.000 | 0.000 | 0.040 | 0.000 | 0.960 | 0.000 | ||
| 1 spectrum, GMGLSMGSMICGWDK | 0.000 | 0.000 | 0.090 | 0.044 | 0.000 | 0.000 | 0.866 | 0.000 |
| Plot | Mito | Lyso or Perox | ER | Golgi | PM | Cytosol | Nucleus | ||||||
| Expt B |
4 peptides |
14 spectra |
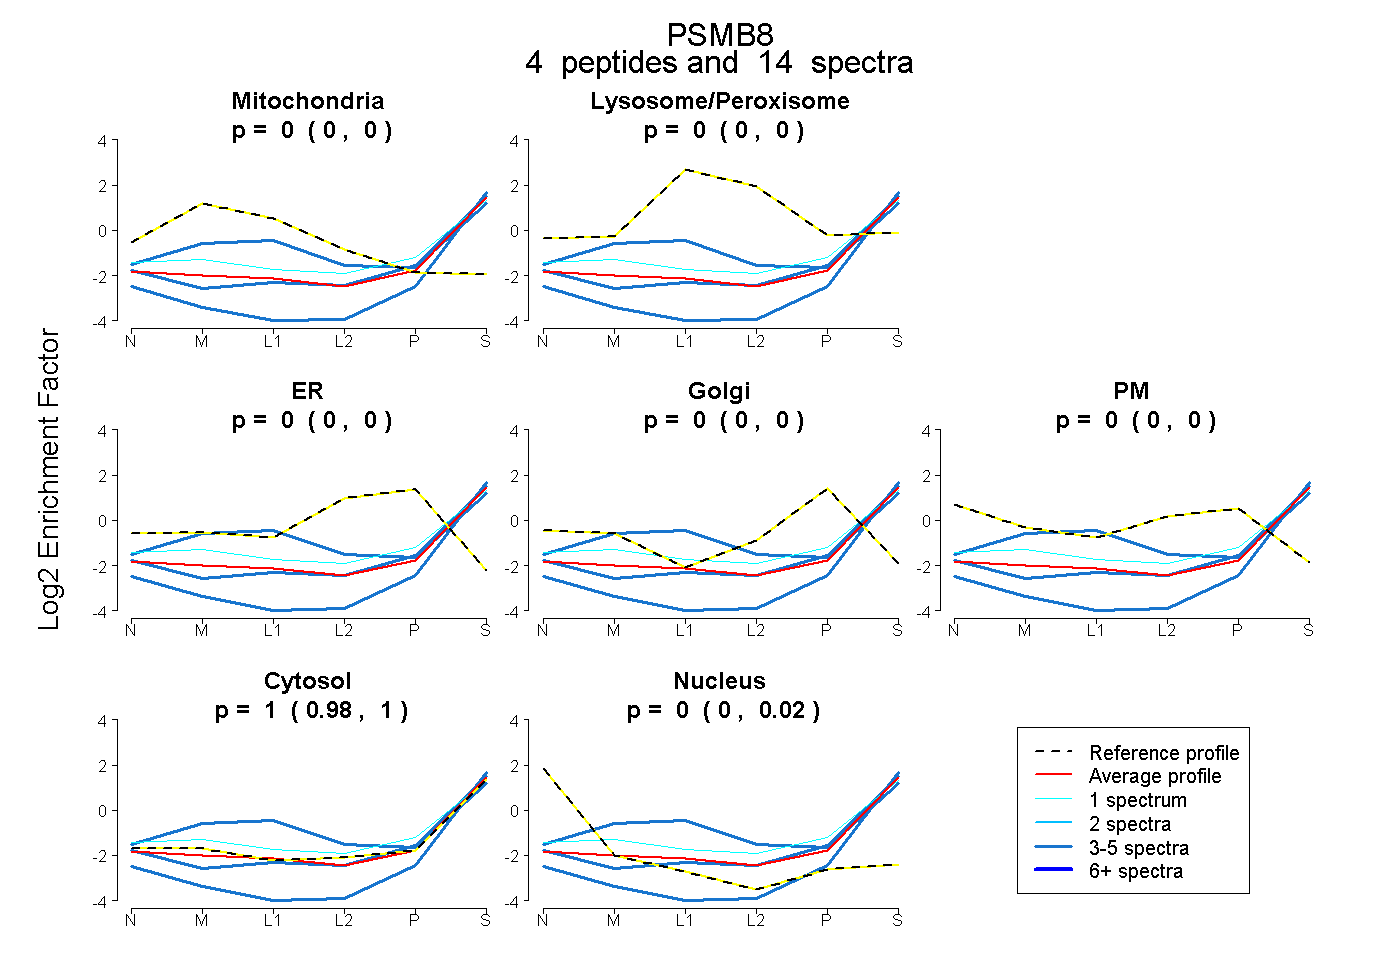 |
0.000 0.000 | 0.000 |
0.000 0.000 | 0.002 |
0.000 0.000 | 0.000 |
0.000 0.000 | 0.000 |
0.000 0.000 | 0.000 |
1.000 0.976 | 1.000 |
0.000 0.000 | 0.016 |
|||
| Plot | Lyso | Other | |||||||||||
| Expt C |
9 peptides |
32 spectra |
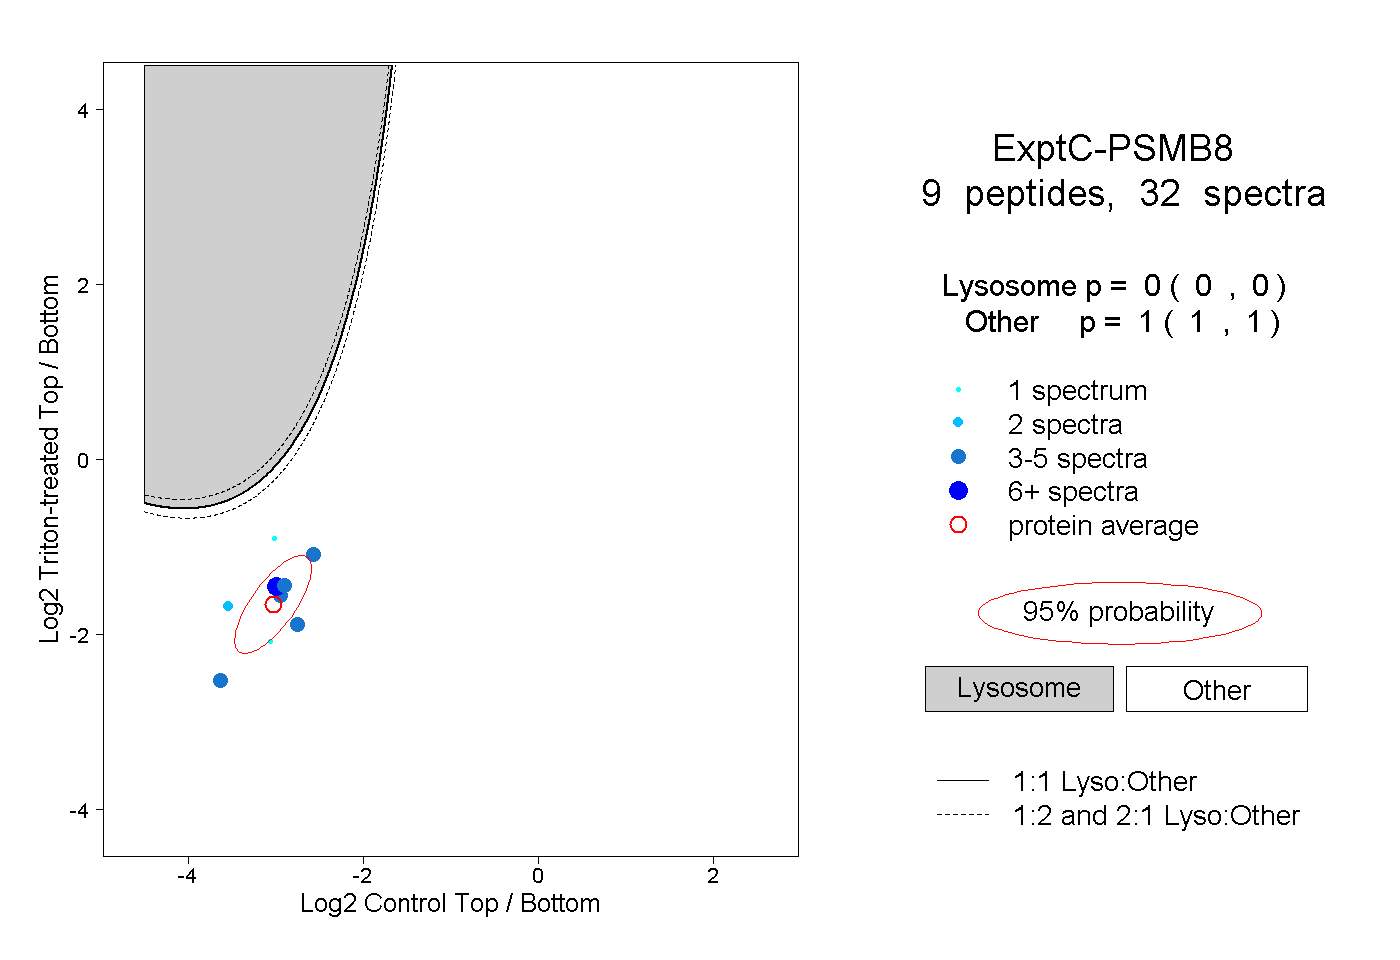 |
0.000 0.000 | 0.000 |
1.000 1.000 | 1.000 |
||||||||
| Plot | Lyso | Other | |||||||||||
| Expt D |
3 peptides |
6 spectra |
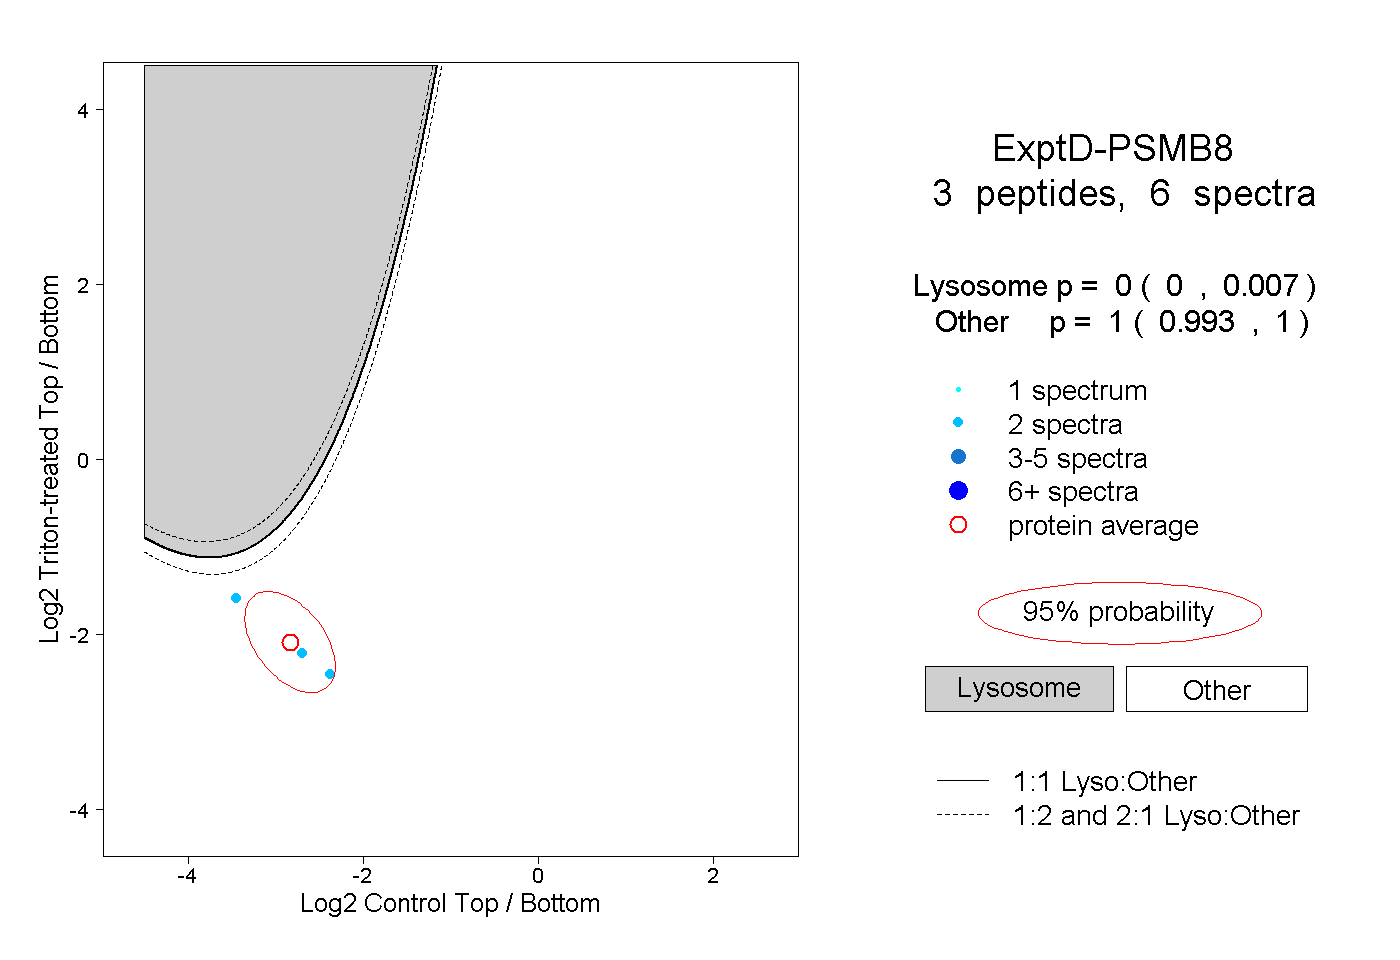 |
0.000 0.000 | 0.007 |
1.000 0.993 | 1.000 |