 12
12peptides
spectra
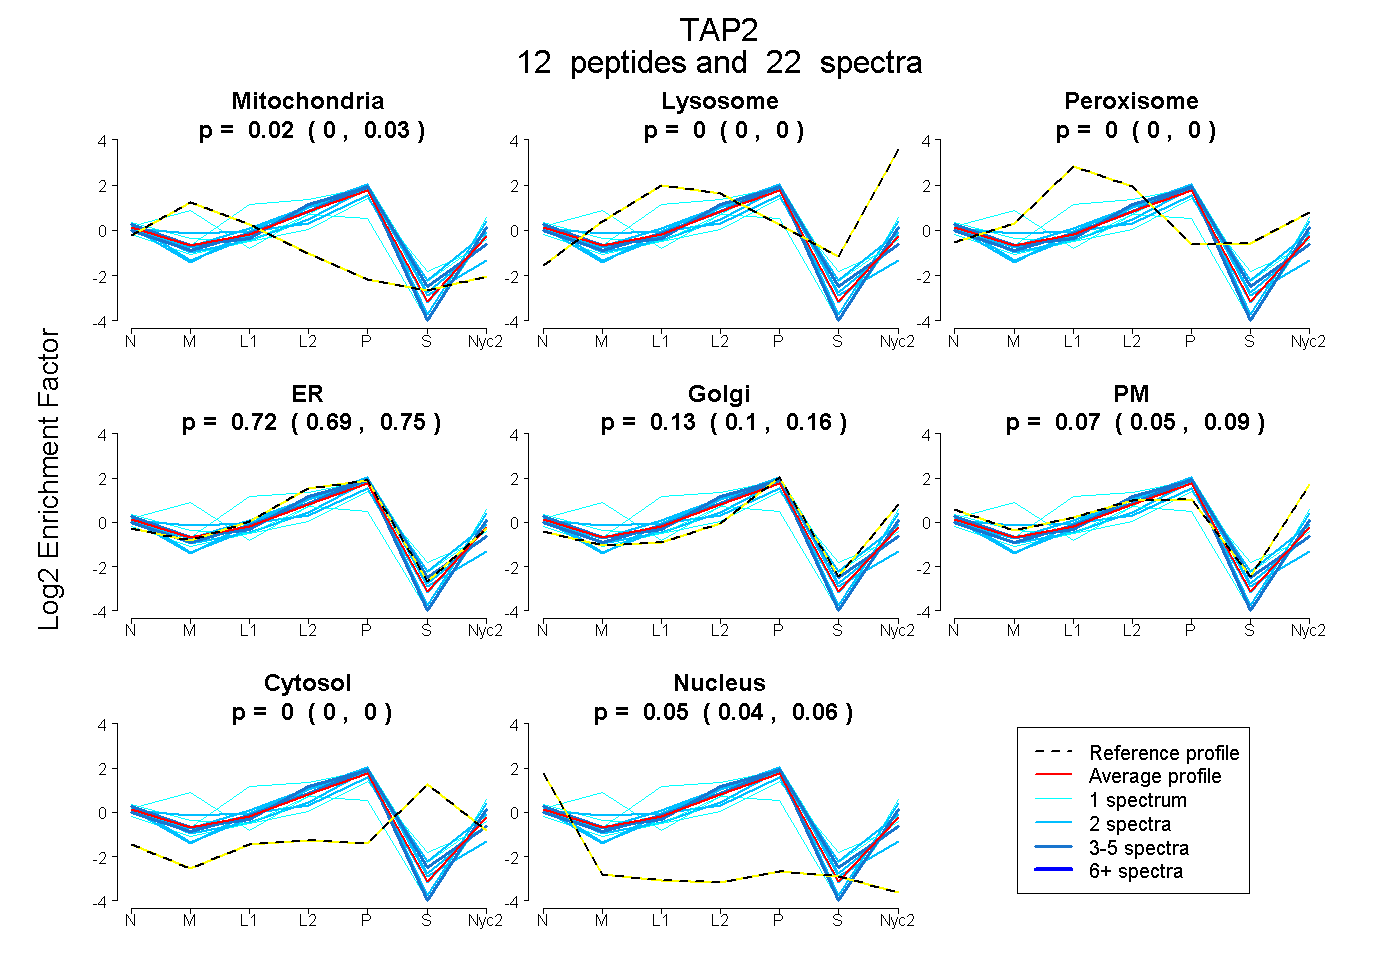
0.002 | 0.031
0.000 | 0.000
0.000 | 0.000
0.691 | 0.746
0.105 | 0.158
0.048 | 0.094
0.000 | 0.000
0.044 | 0.063
3peptides
spectra
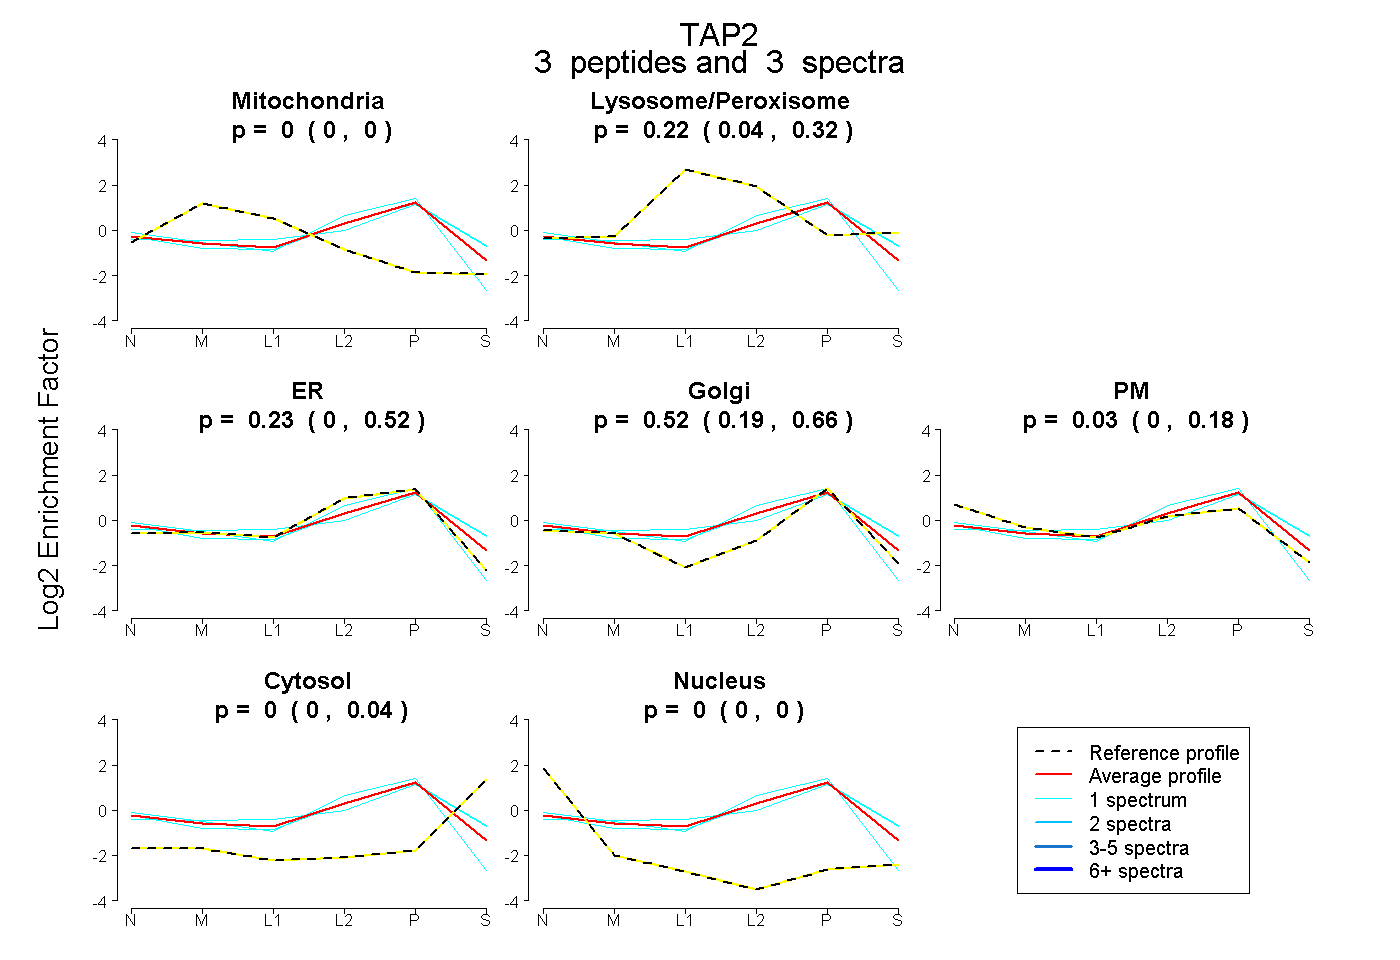
0.000 | 0.000
0.042 | 0.323
0.000 | 0.515
0.190 | 0.659
0.000 | 0.175
0.000 | 0.040
0.000 | 0.000
12peptides
spectra
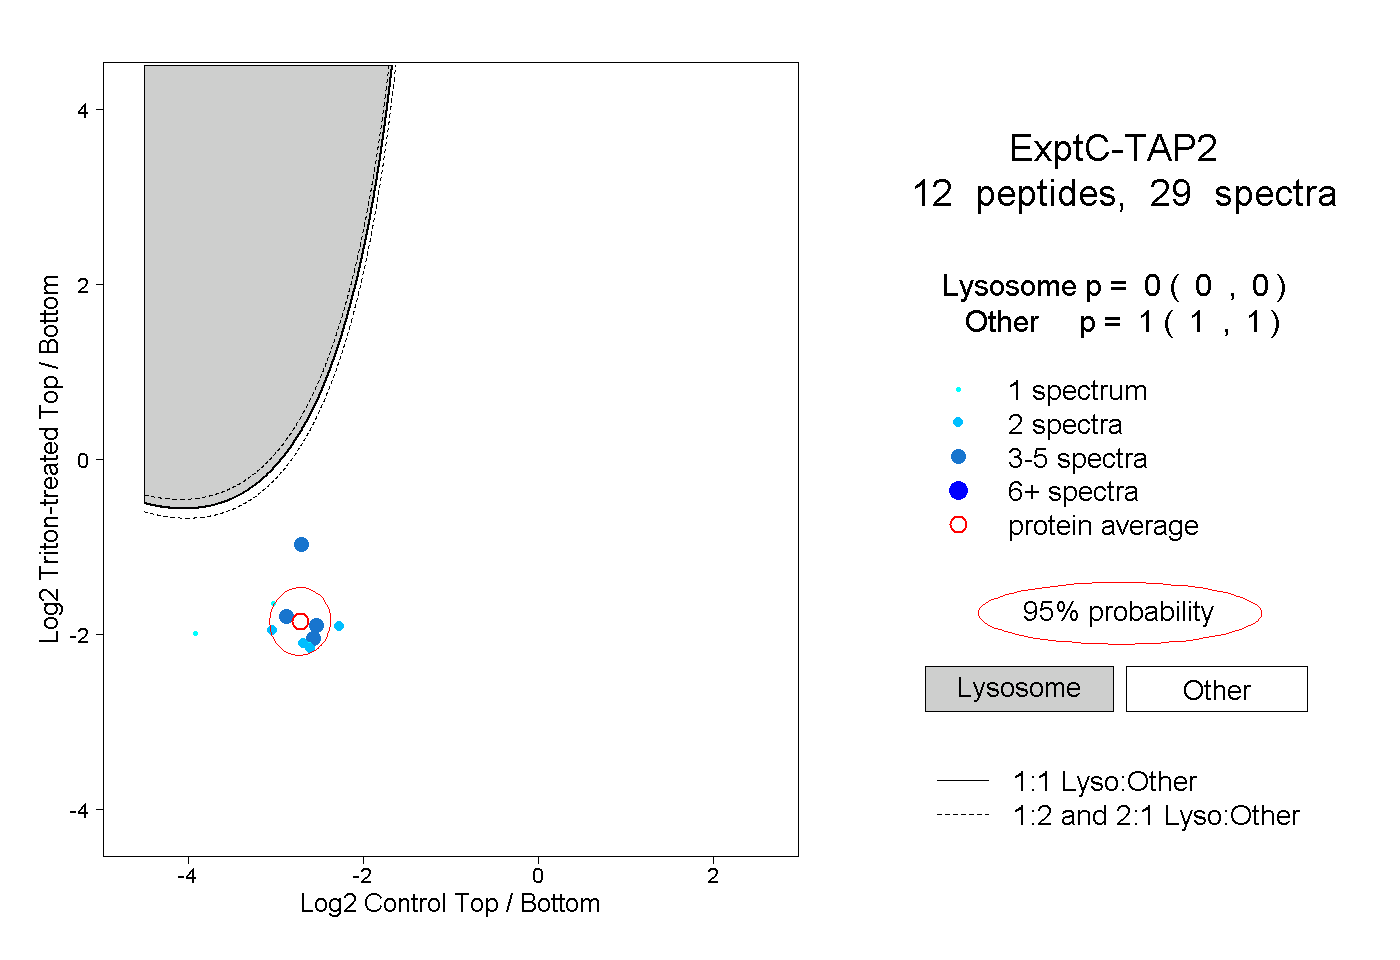
0.000 | 0.000
1.000 | 1.000
3peptides
spectra
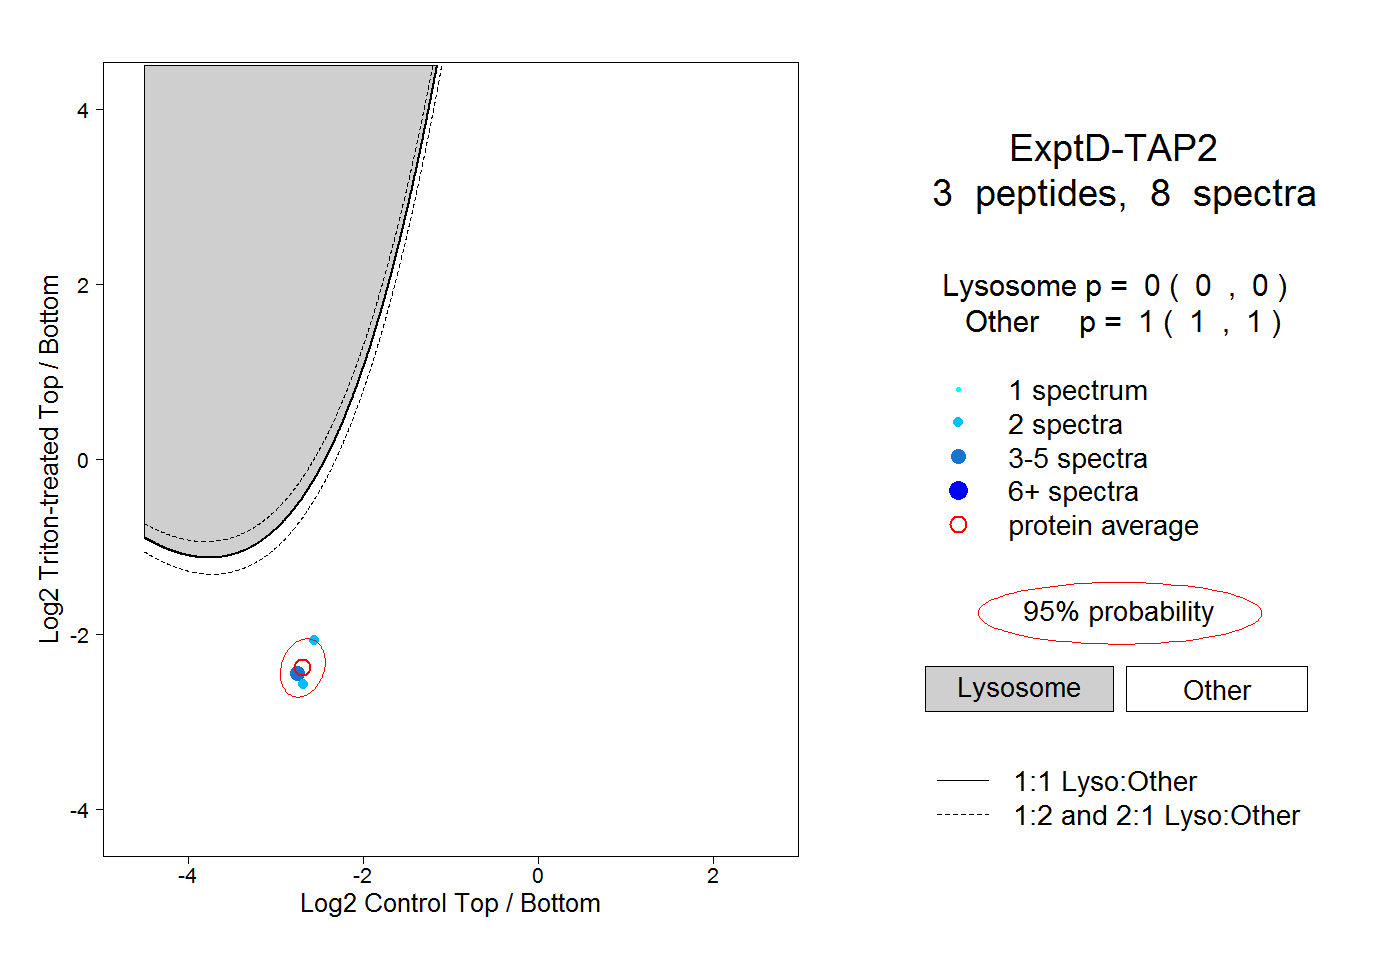
0.000 | 0.000
1.000 | 1.000