 12
12peptides
spectra
0.002 | 0.031
0.000 | 0.000
0.000 | 0.000
0.691 | 0.746
0.105 | 0.158
0.048 | 0.094
0.000 | 0.000
0.044 | 0.063
| Plot | Mito | Lyso | Perox | ER | Golgi | PM | Cytosol | Nucleus | |||||
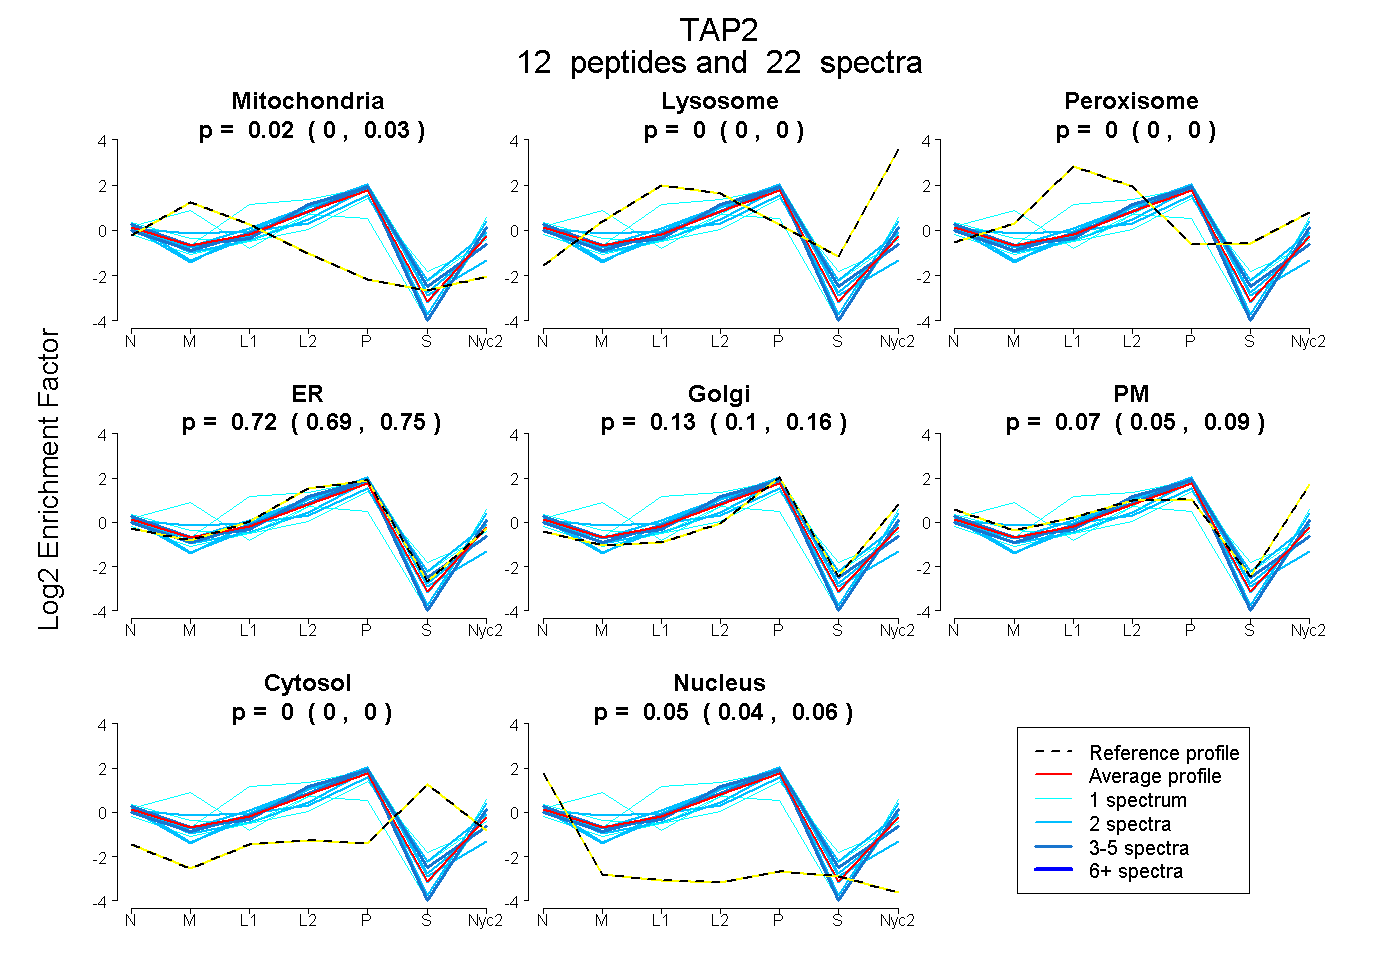
| Expt A |
12 peptides |
22 spectra |
|
0.017 0.002 | 0.031 |
0.000 0.000 | 0.000 |
0.000 0.000 | 0.000 |
0.720 0.691 | 0.746 |
0.134 0.105 | 0.158 |
0.074 0.048 | 0.094 |
0.000 0.000 | 0.000 |
0.055 0.044 | 0.063 |
| 2 spectra, GGSFLFTMSR | 0.000 | 0.000 | 0.000 | 0.664 | 0.127 | 0.209 | 0.000 | 0.000 | ||
| 1 spectrum, ELYLVIR | 0.146 | 0.000 | 0.000 | 0.412 | 0.337 | 0.000 | 0.048 | 0.057 | ||
| 1 spectrum, GGLLSFLLYQEEVGHHVR | 0.272 | 0.000 | 0.000 | 0.106 | 0.100 | 0.521 | 0.000 | 0.000 | ||
| 2 spectra, EQLFSSLLR | 0.000 | 0.000 | 0.000 | 0.728 | 0.157 | 0.099 | 0.000 | 0.016 | ||
| 2 spectra, RPNLPKPGTLAPPR | 0.000 | 0.000 | 0.000 | 0.894 | 0.000 | 0.000 | 0.000 | 0.106 | ||
| 2 spectra, GSQLAVGQK | 0.181 | 0.000 | 0.000 | 0.458 | 0.301 | 0.061 | 0.000 | 0.000 | ||
| 3 spectra, TMLVIAHR | 0.000 | 0.000 | 0.000 | 0.823 | 0.107 | 0.000 | 0.000 | 0.070 | ||
| 2 spectra, DNIAYGLR | 0.000 | 0.000 | 0.000 | 0.657 | 0.236 | 0.000 | 0.000 | 0.107 | ||
| 3 spectra, VGGLLR | 0.000 | 0.000 | 0.000 | 0.723 | 0.071 | 0.169 | 0.000 | 0.036 | ||
| 2 spectra, SFGAEEQEVSR | 0.000 | 0.000 | 0.000 | 0.681 | 0.157 | 0.082 | 0.033 | 0.047 | ||
| 1 spectrum, ALVGSTMSTSVLR | 0.014 | 0.000 | 0.000 | 0.863 | 0.000 | 0.123 | 0.000 | 0.000 | ||
| 1 spectrum, HQAVLK | 0.000 | 0.000 | 0.000 | 0.631 | 0.294 | 0.000 | 0.029 | 0.045 |
| Plot | Mito | Lyso or Perox | ER | Golgi | PM | Cytosol | Nucleus | ||||||
| Expt B |
3 peptides |
3 spectra |
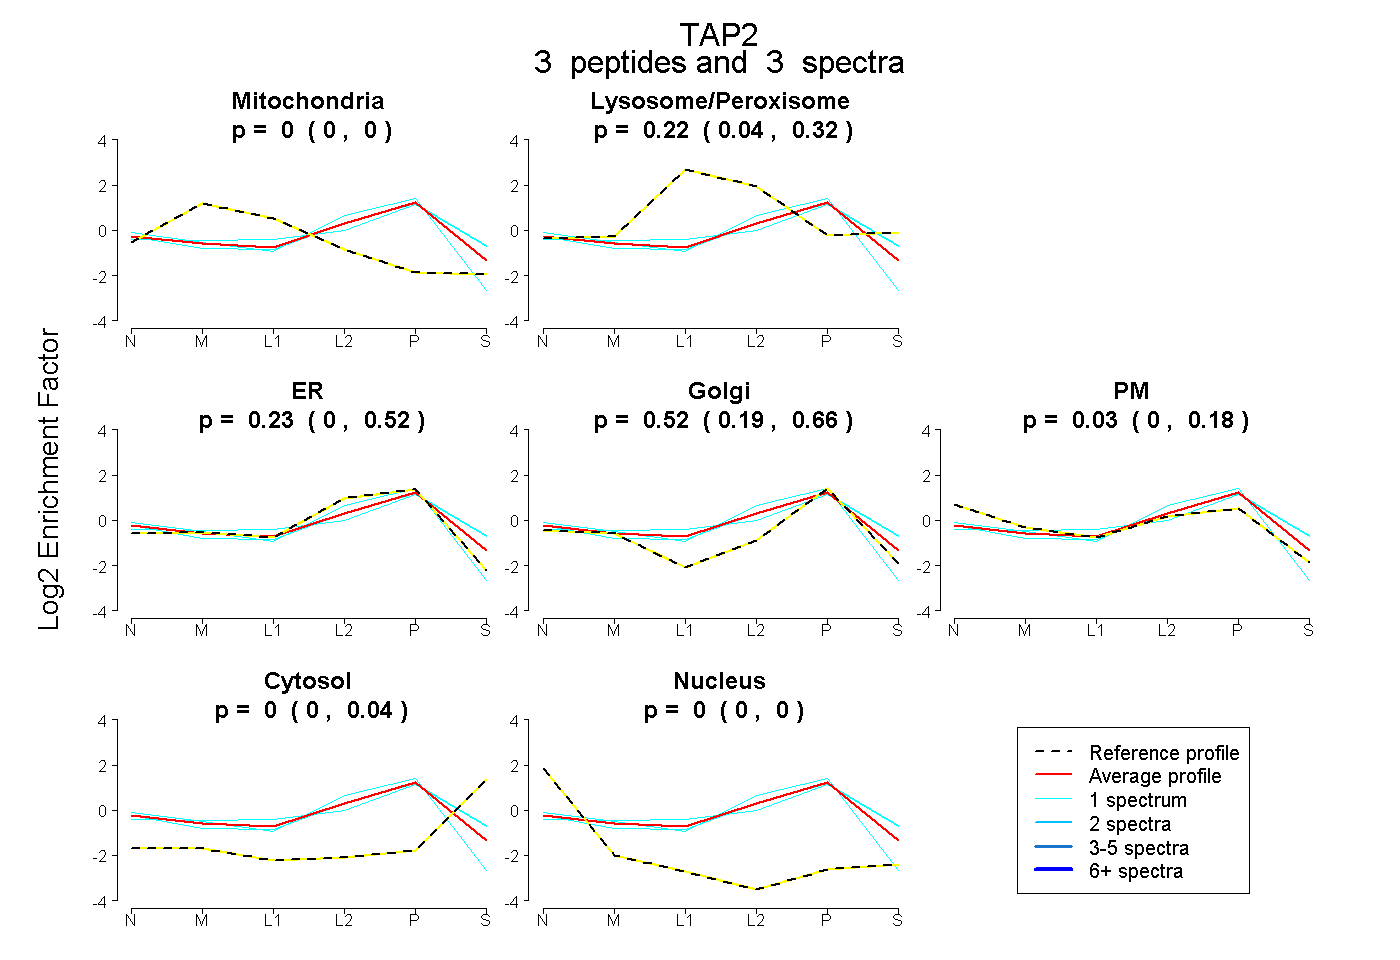 |
0.000 0.000 | 0.000 |
0.224 0.042 | 0.323 |
0.228 0.000 | 0.515 |
0.515 0.190 | 0.659 |
0.033 0.000 | 0.175 |
0.000 0.000 | 0.040 |
0.000 0.000 | 0.000 |
|||
| Plot | Lyso | Other | |||||||||||
| Expt C |
12 peptides |
29 spectra |
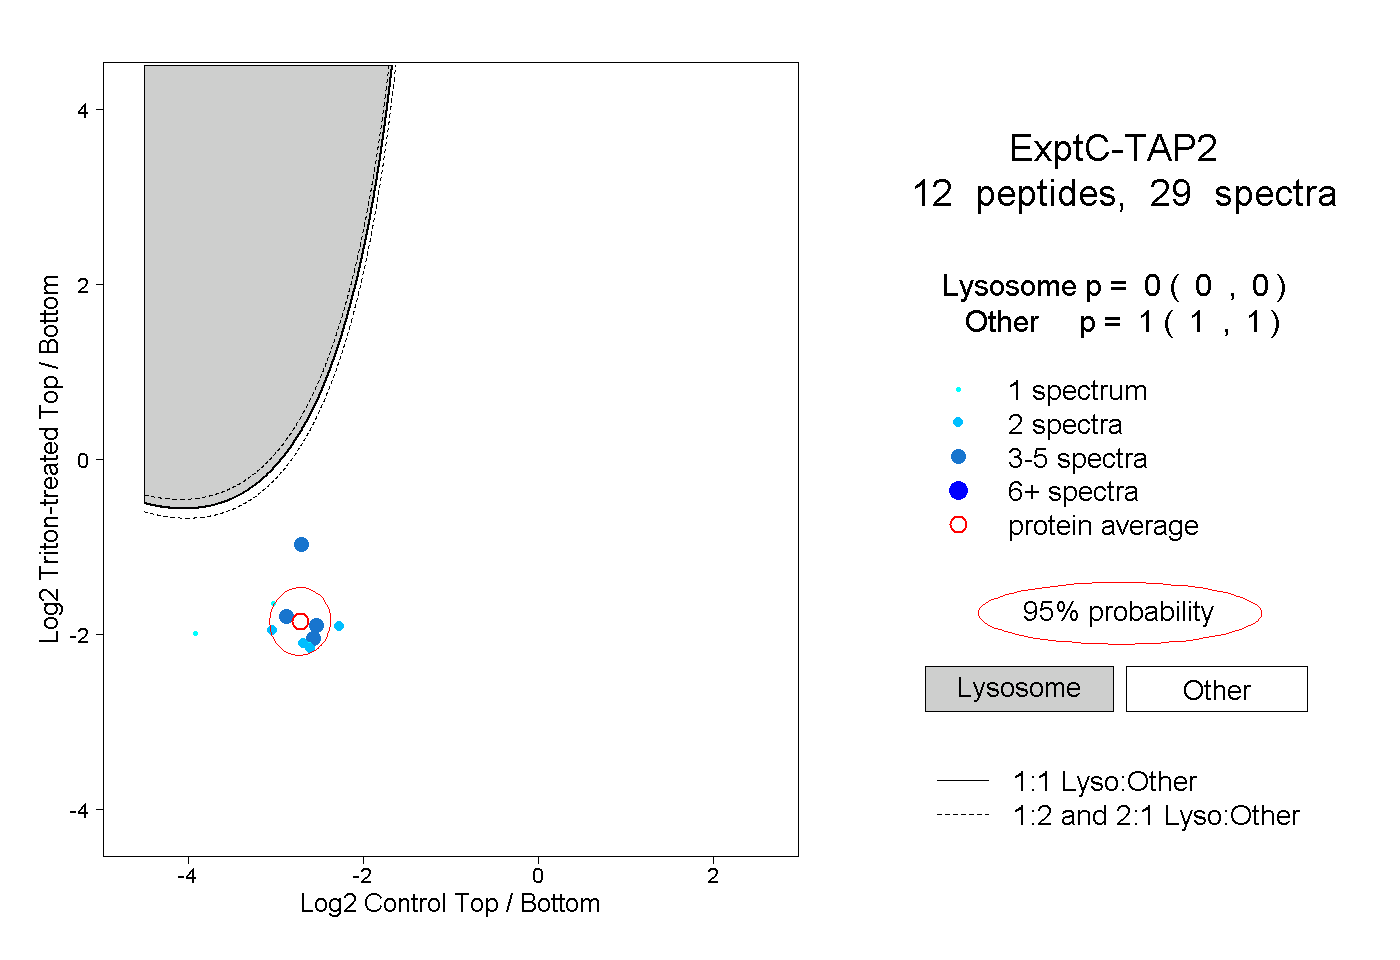 |
0.000 0.000 | 0.000 |
1.000 1.000 | 1.000 |
||||||||
| Plot | Lyso | Other | |||||||||||
| Expt D |
3 peptides |
8 spectra |
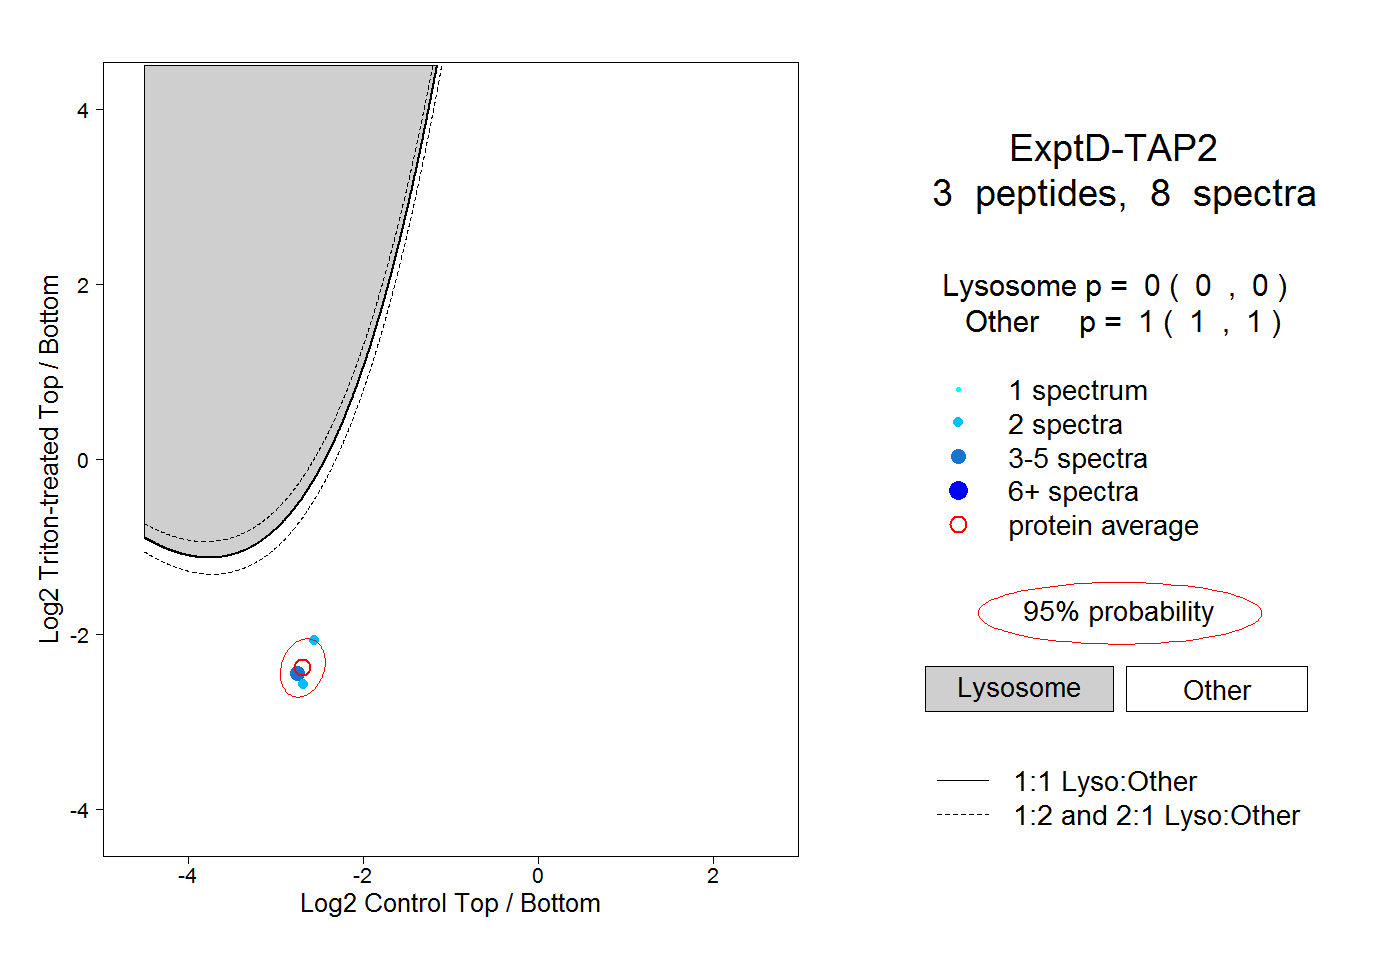 |
0.000 0.000 | 0.000 |
1.000 1.000 | 1.000 |