 2
2peptides
spectra
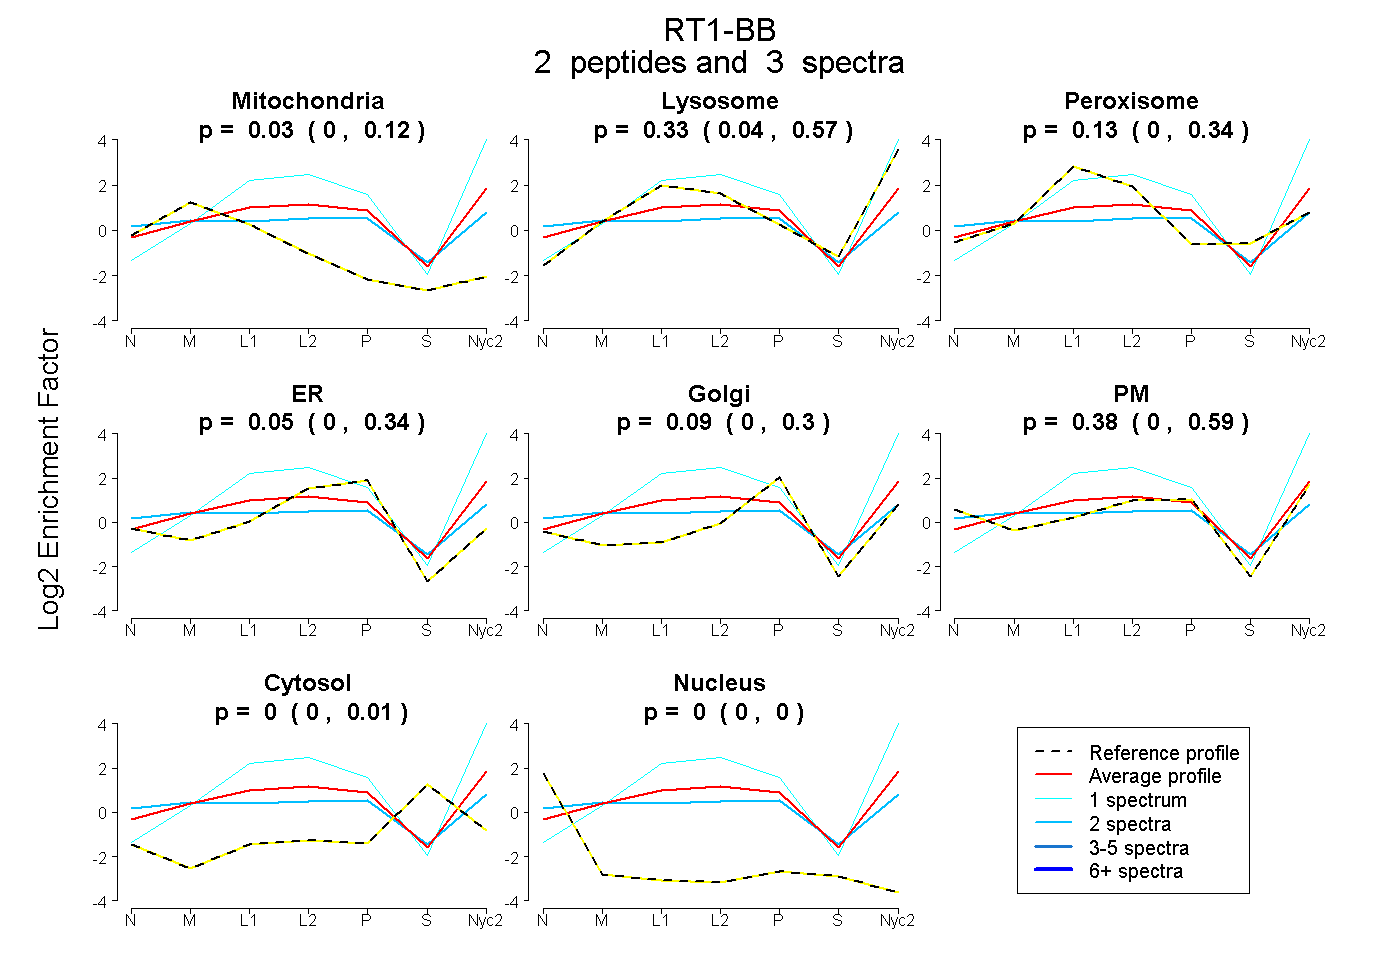
0.000 | 0.115
0.040 | 0.573
0.000 | 0.338
0.000 | 0.336
0.000 | 0.297
0.000 | 0.589
0.000 | 0.009
0.000 | 0.000
5peptides
spectra
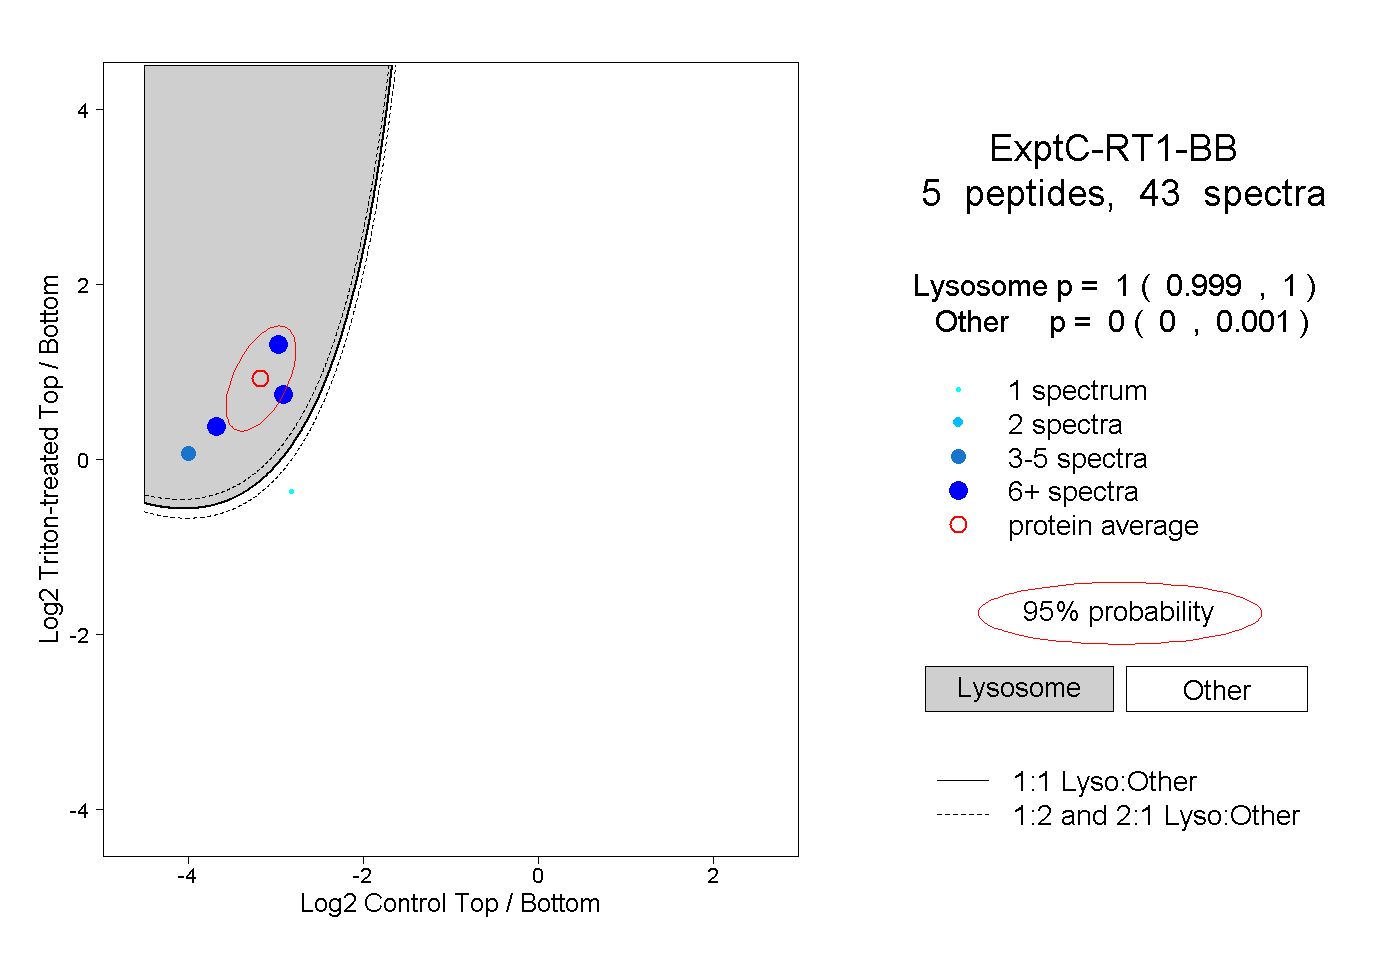
0.999 | 1.000
0.000 | 0.001
1peptide
spectrum
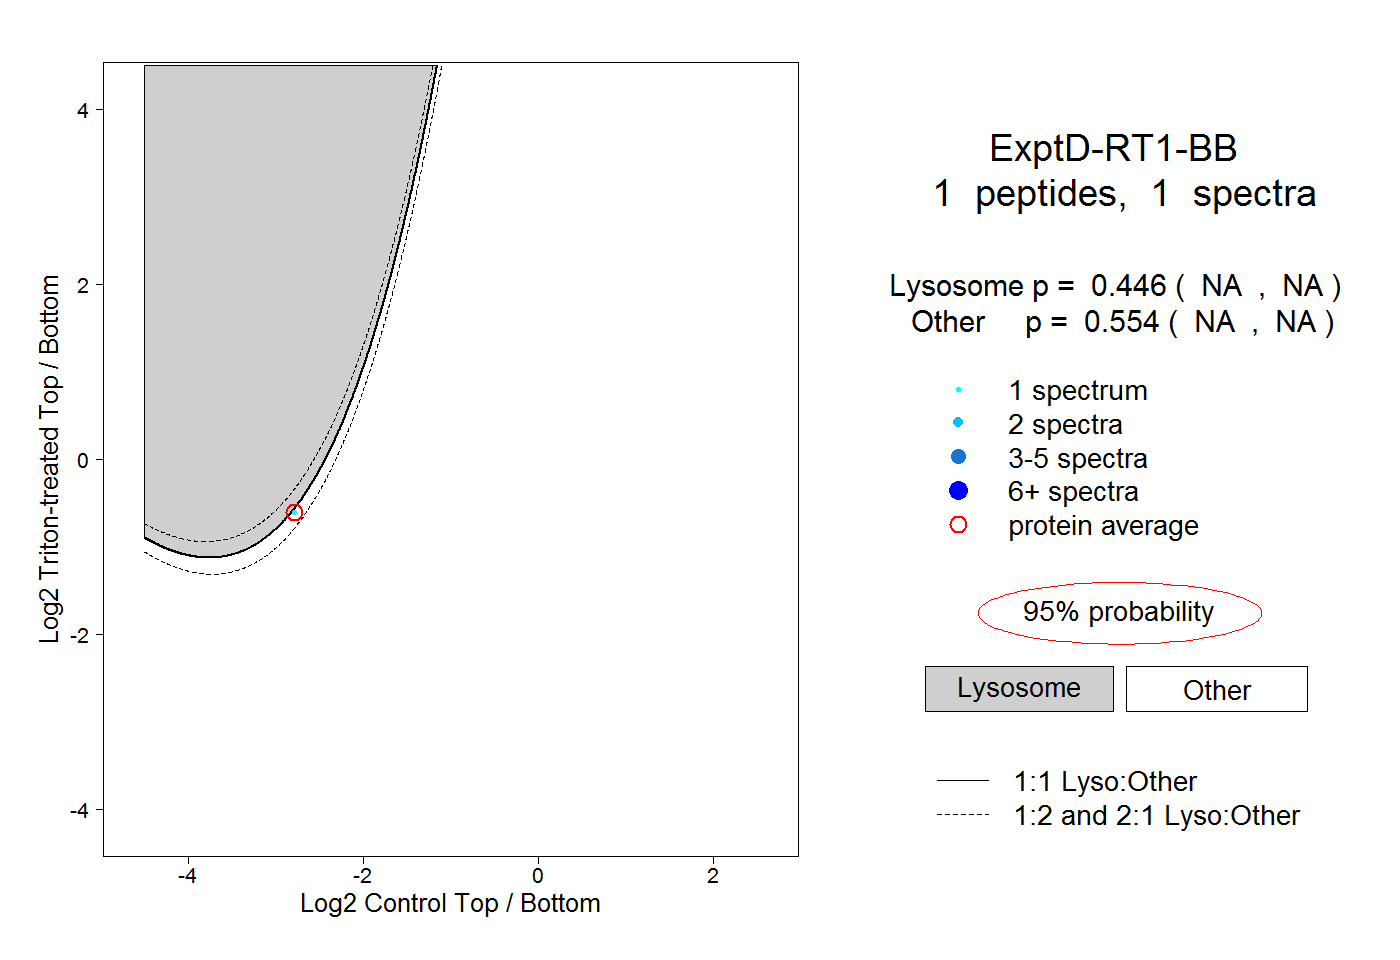
NA | NA
NA | NA