 2
2peptides
spectra
0.000 | 0.115
0.040 | 0.573
0.000 | 0.338
0.000 | 0.336
0.000 | 0.297
0.000 | 0.589
0.000 | 0.009
0.000 | 0.000
| Plot | Mito | Lyso | Perox | ER | Golgi | PM | Cytosol | Nucleus | |||||
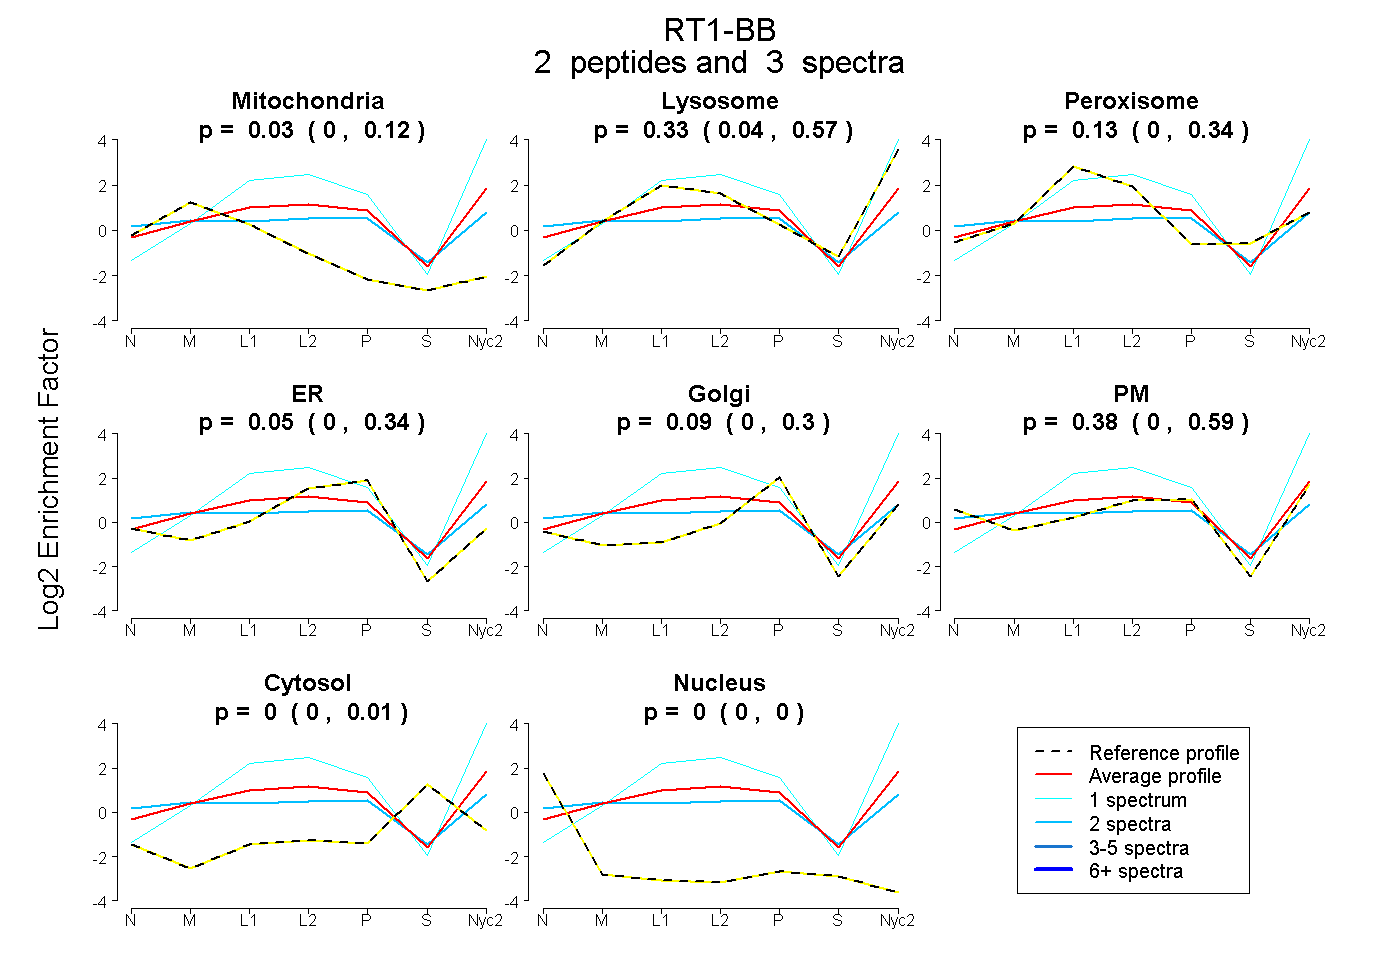
| Expt A |
2 peptides |
3 spectra |
|
0.030 0.000 | 0.115 |
0.332 0.040 | 0.573 |
0.129 0.000 | 0.338 |
0.048 0.000 | 0.336 |
0.085 0.000 | 0.297 |
0.376 0.000 | 0.589 |
0.000 0.000 | 0.009 |
0.000 0.000 | 0.000 |
| 2 spectra, GPPPAGLLQ | 0.153 | 0.035 | 0.193 | 0.000 | 0.138 | 0.442 | 0.038 | 0.000 | ||
| 1 spectrum, LEQPNVAISLSR | 0.000 | 0.941 | 0.000 | 0.059 | 0.000 | 0.000 | 0.000 | 0.000 |
| Plot | Lyso | Other | |||||||||||
| Expt C |
5 peptides |
43 spectra |
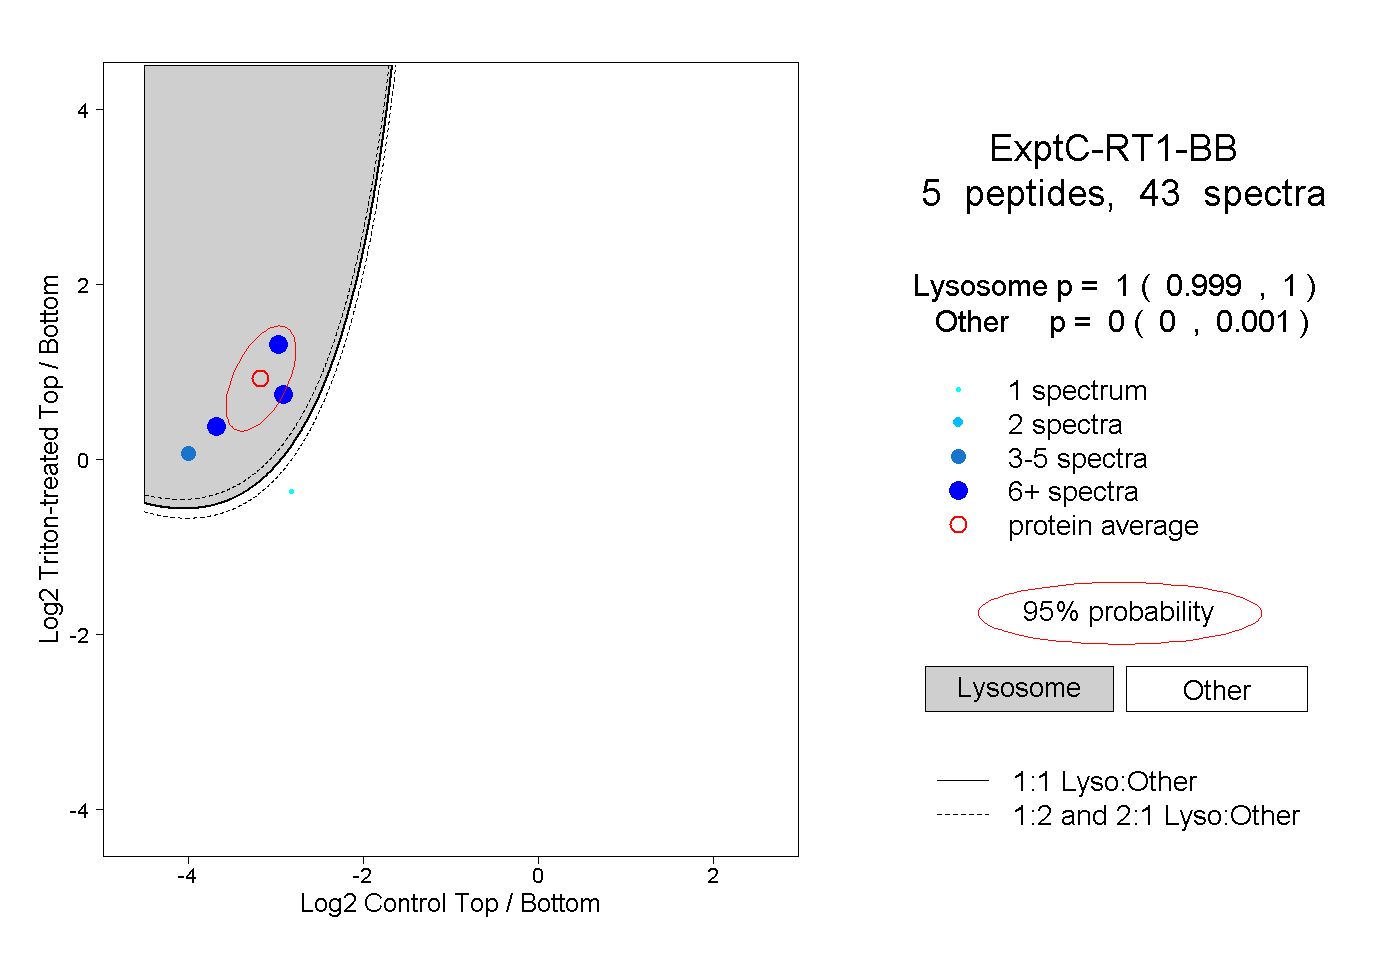 |
1.000 0.999 | 1.000 |
0.000 0.000 | 0.001 |
||||||||
| Plot | Lyso | Other | |||||||||||
| Expt D |
1 peptide |
1 spectrum |
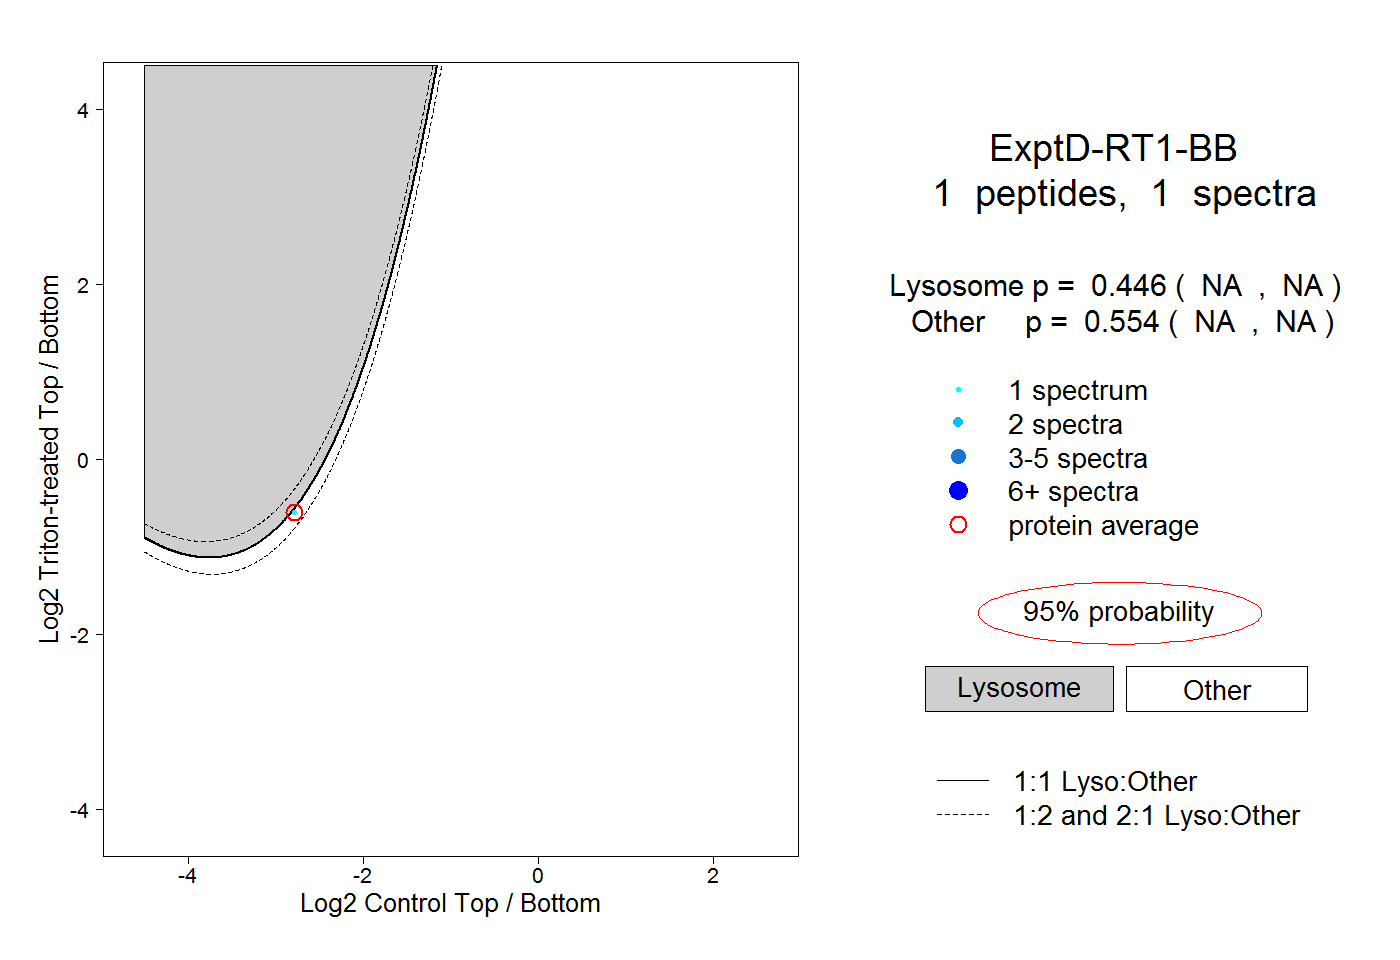 |
0.446 NA | NA |
0.554 NA | NA |