 3
3peptides
spectra
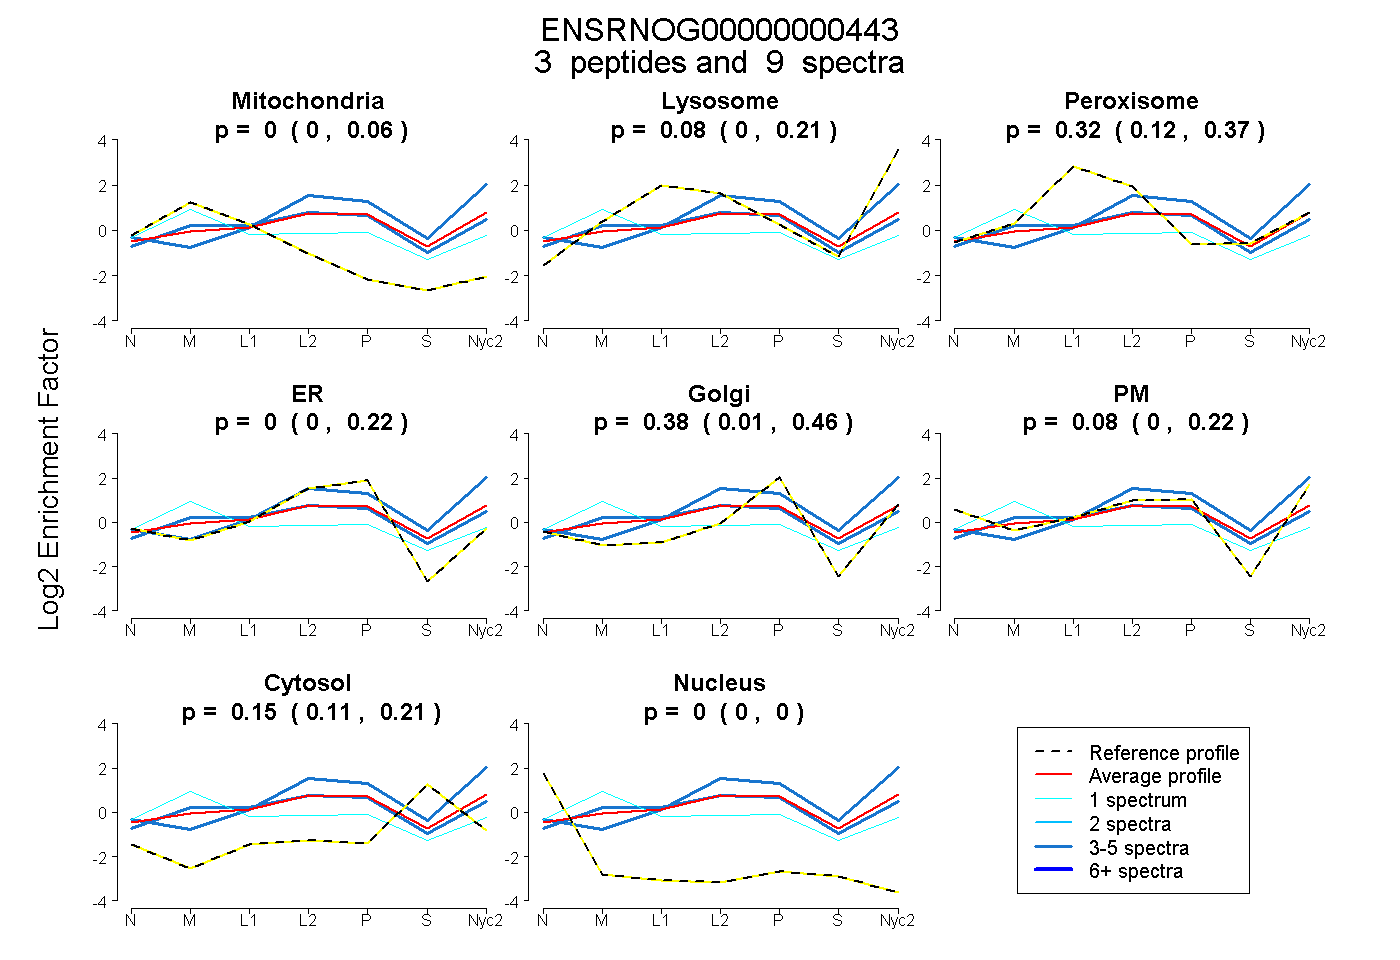
0.000 | 0.056
0.000 | 0.210
0.120 | 0.370
0.000 | 0.221
0.008 | 0.460
0.000 | 0.221
0.106 | 0.210
0.000 | 0.000
1peptide
spectra
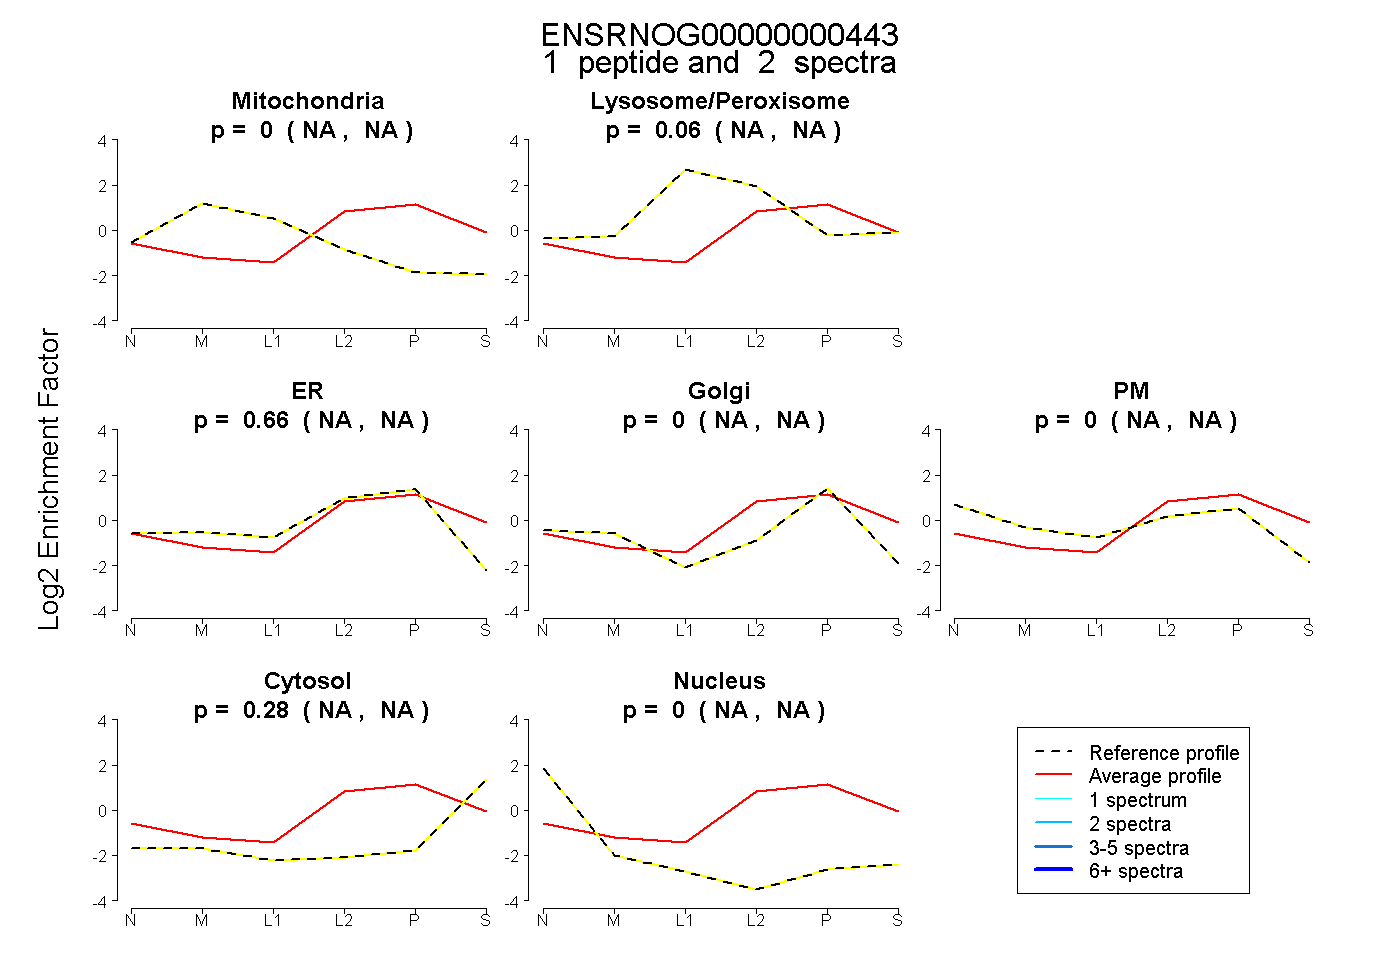
NA | NA
NA | NA
NA | NA
NA | NA
NA | NA
NA | NA
NA | NA
2peptides
spectra
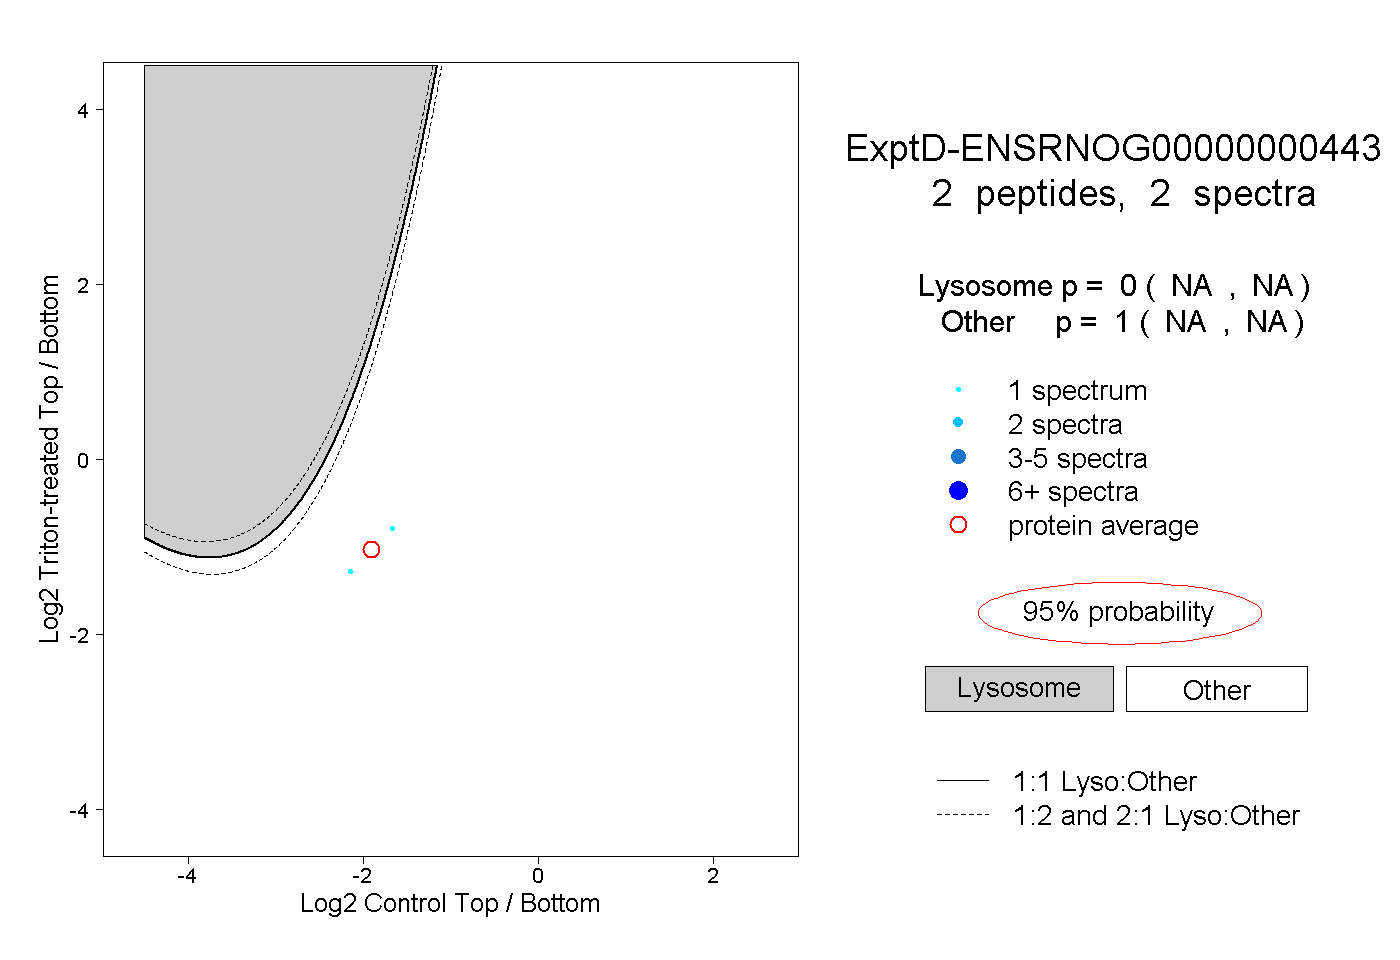
NA | NA
NA | NA