 3
3peptides
spectra
0.000 | 0.056
0.000 | 0.210
0.120 | 0.370
0.000 | 0.221
0.008 | 0.460
0.000 | 0.221
0.106 | 0.210
0.000 | 0.000
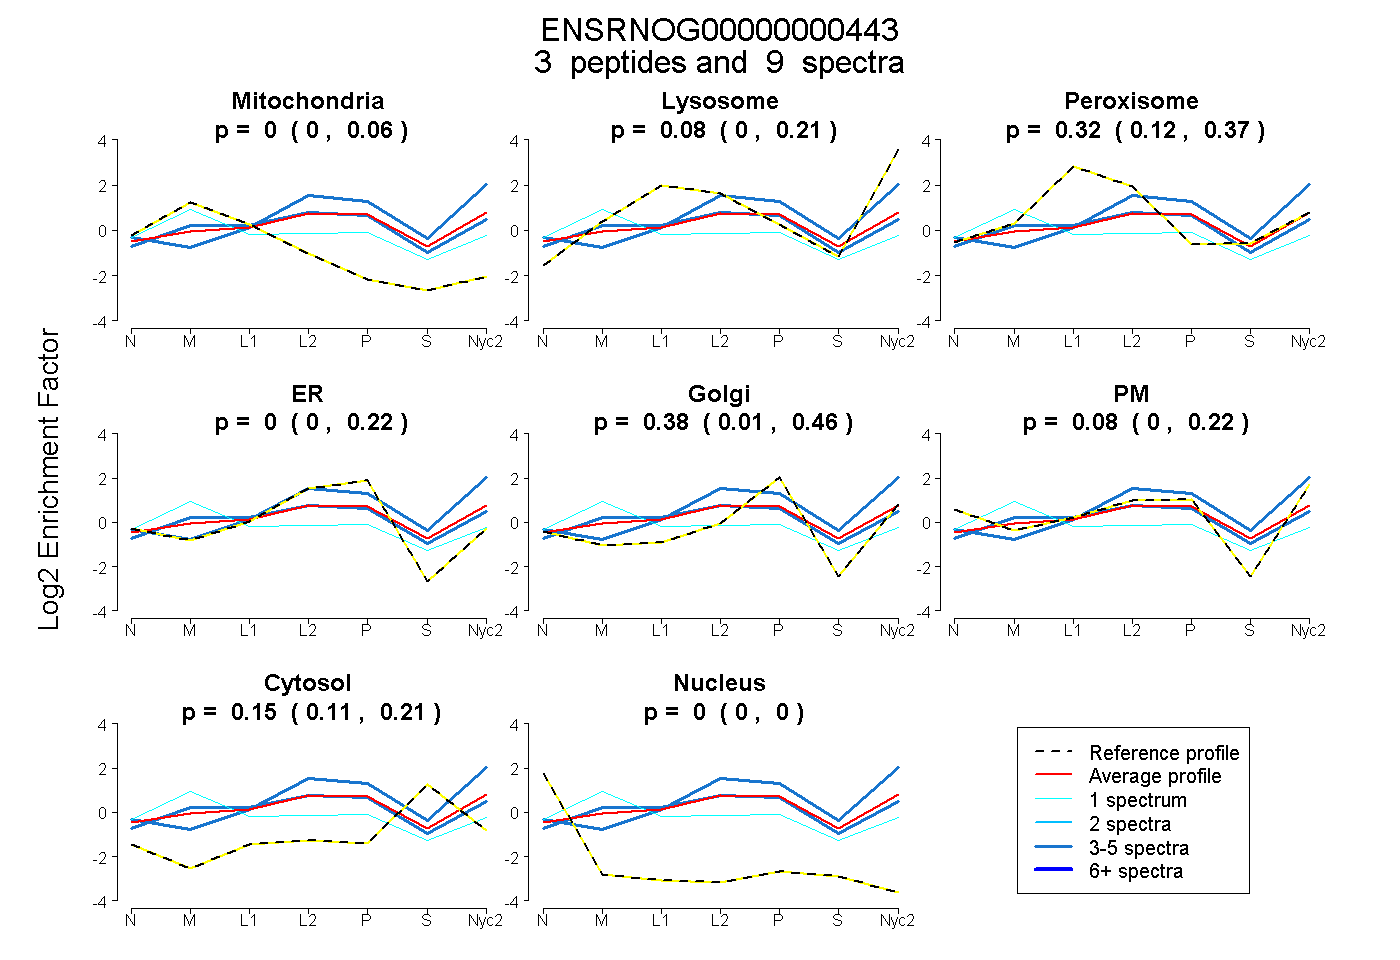
| Plot | Mito | Lyso | Perox | ER | Golgi | PM | Cytosol | Nucleus | |||||
| Expt A |
3 peptides |
9 spectra |
|
0.000 0.000 | 0.056 |
0.075 0.000 | 0.210 |
0.318 0.120 | 0.370 |
0.000 0.000 | 0.221 |
0.381 0.008 | 0.460 |
0.079 0.000 | 0.221 |
0.148 0.106 | 0.210 |
0.000 0.000 | 0.000 |
| 4 spectra, TYNVLDMK | 0.100 | 0.176 | 0.192 | 0.177 | 0.231 | 0.000 | 0.124 | 0.000 | ||
| 1 spectrum, VQYTVCIWR | 0.418 | 0.107 | 0.092 | 0.000 | 0.293 | 0.013 | 0.077 | 0.000 | ||
| 4 spectra, LTSLSDR | 0.000 | 0.389 | 0.000 | 0.121 | 0.063 | 0.267 | 0.160 | 0.000 |
| Plot | Mito | Lyso or Perox | ER | Golgi | PM | Cytosol | Nucleus | ||||||
| Expt B |
1 peptide |
2 spectra |
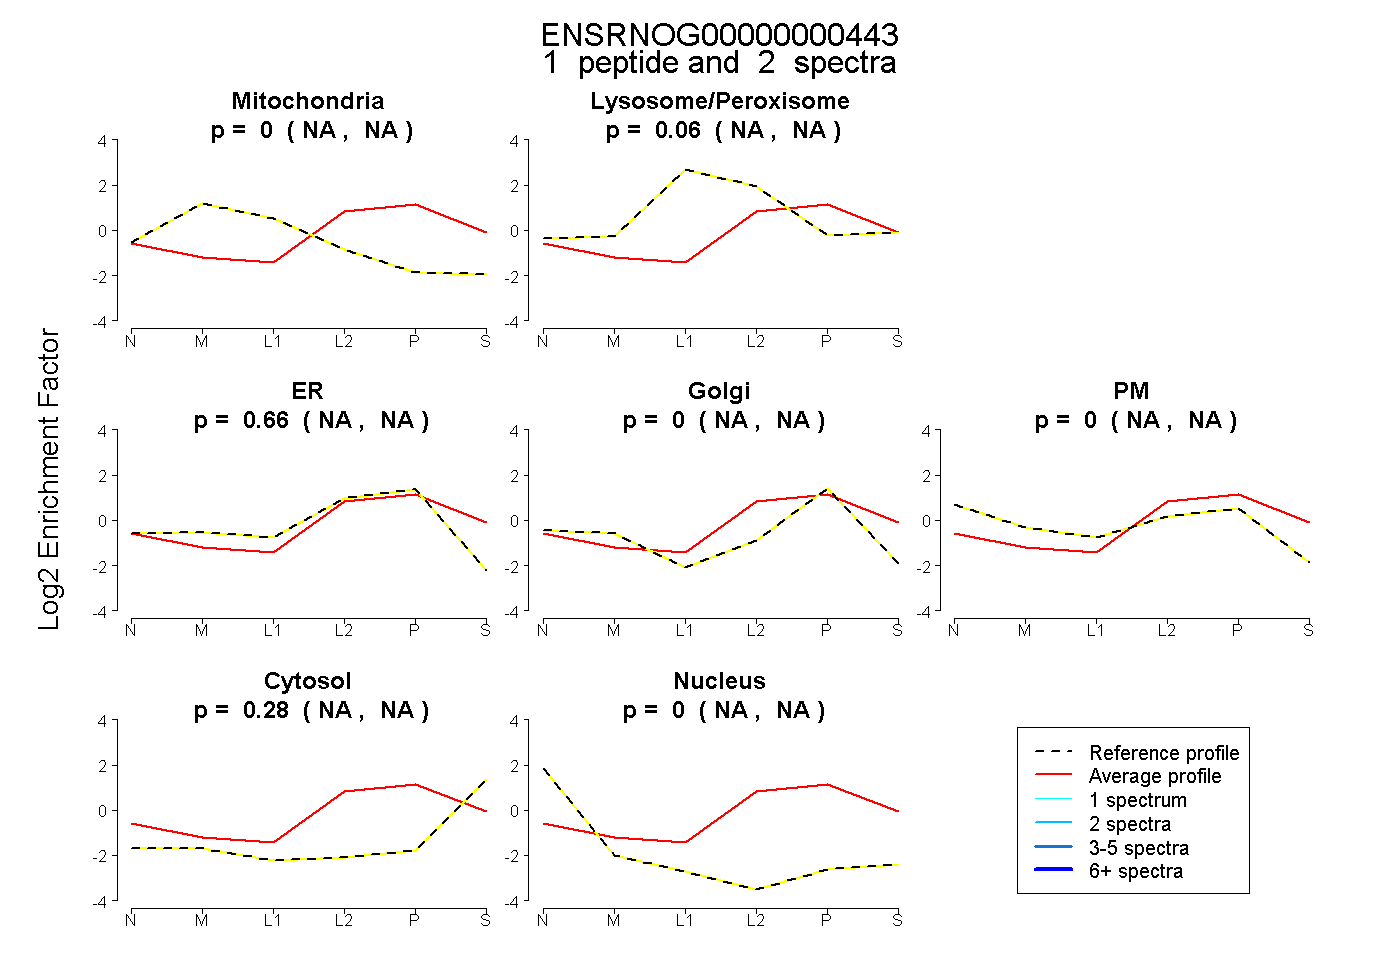 |
0.000 NA | NA |
0.056 NA | NA |
0.663 NA | NA |
0.000 NA | NA |
0.000 NA | NA |
0.281 NA | NA |
0.000 NA | NA |
|||
| Plot | Lyso | Other | |||||||||||
| Expt D |
2 peptides |
2 spectra |
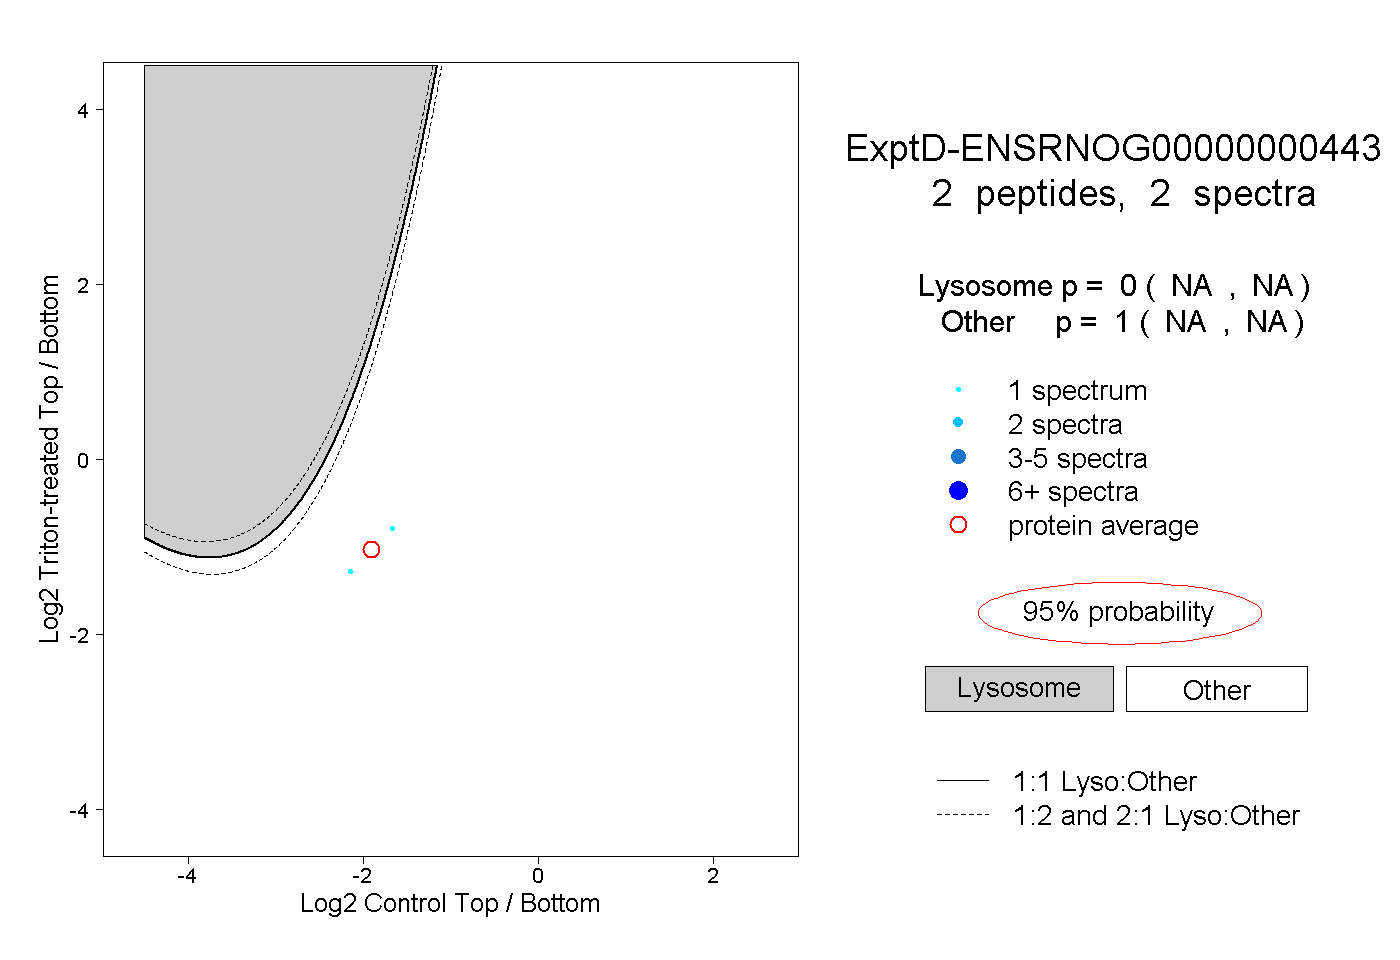 |
0.000 NA | NA |
1.000 NA | NA |