 4
4peptides
spectra
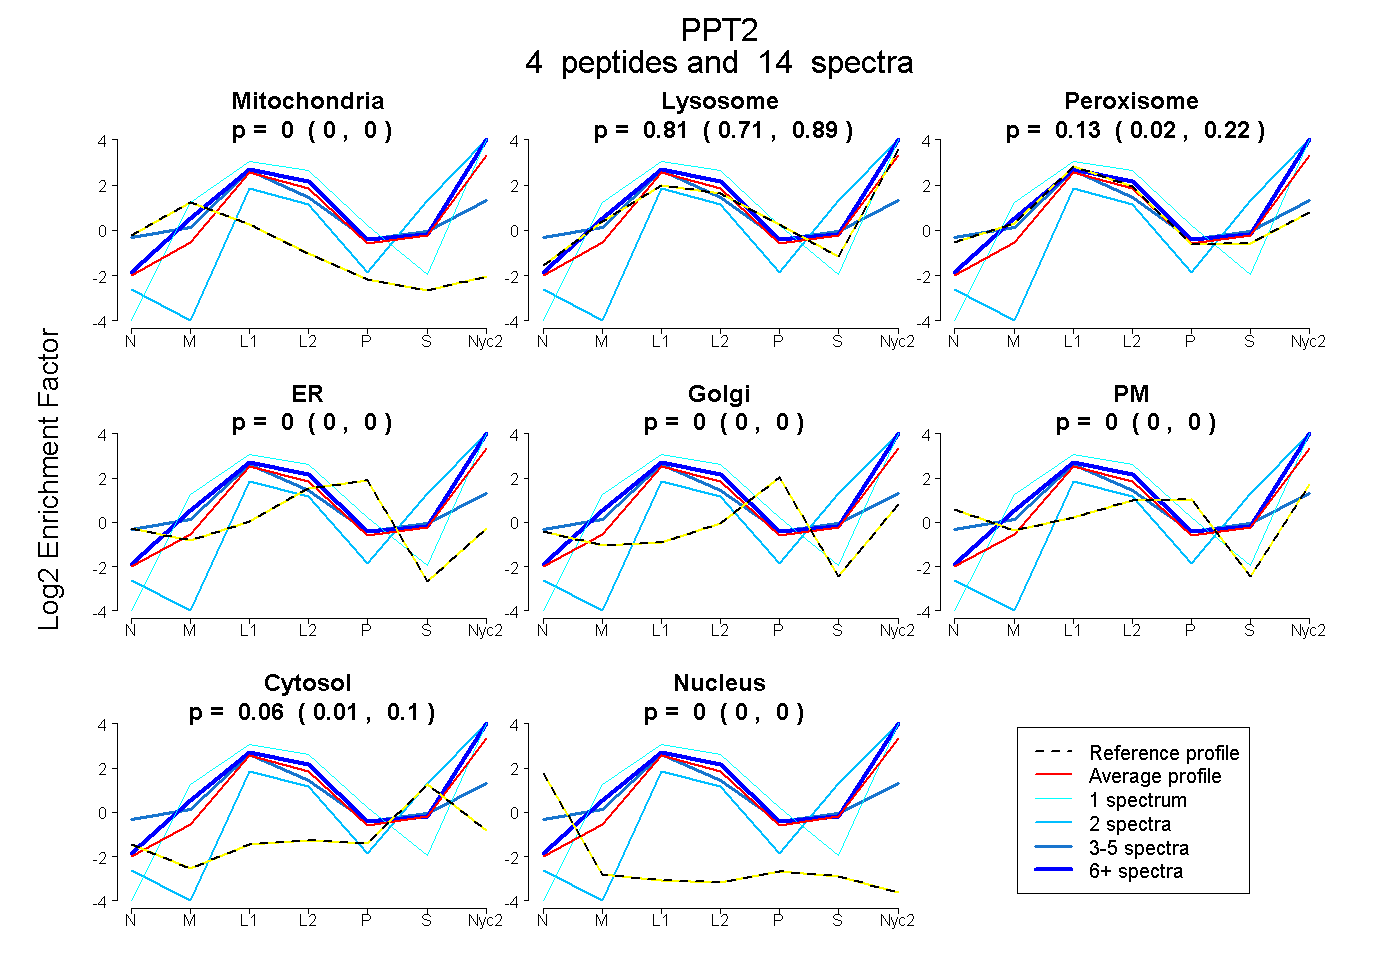
0.000 | 0.000
0.712 | 0.892
0.021 | 0.217
0.000 | 0.000
0.000 | 0.000
0.000 | 0.000
0.012 | 0.098
0.000 | 0.000
2peptides
spectra
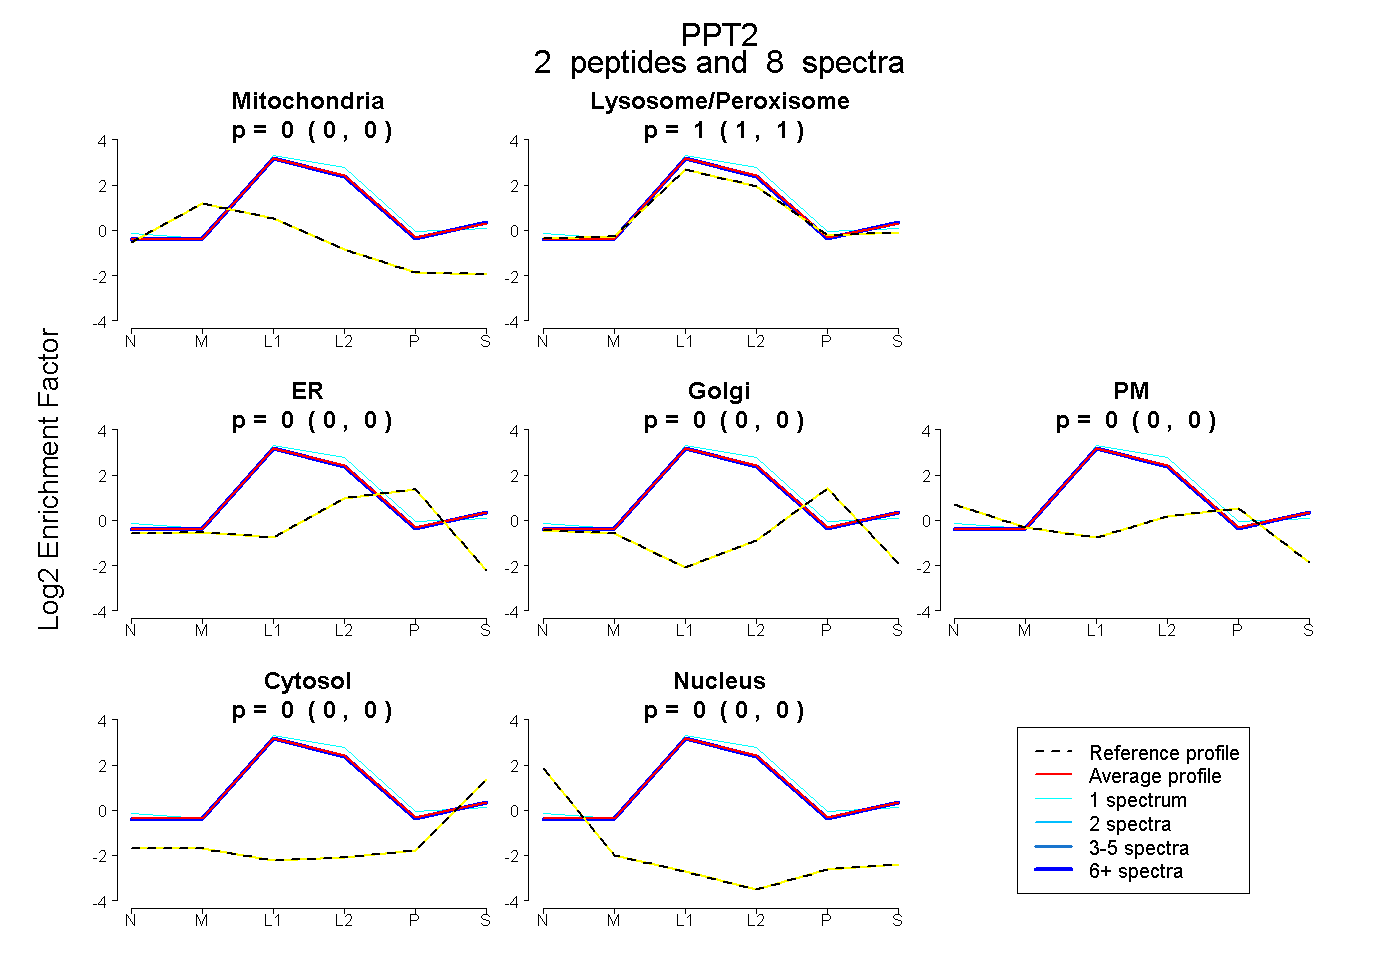
0.000 | 0.000
1.000 | 1.000
0.000 | 0.000
0.000 | 0.000
0.000 | 0.000
0.000 | 0.000
0.000 | 0.000
5peptides
spectra
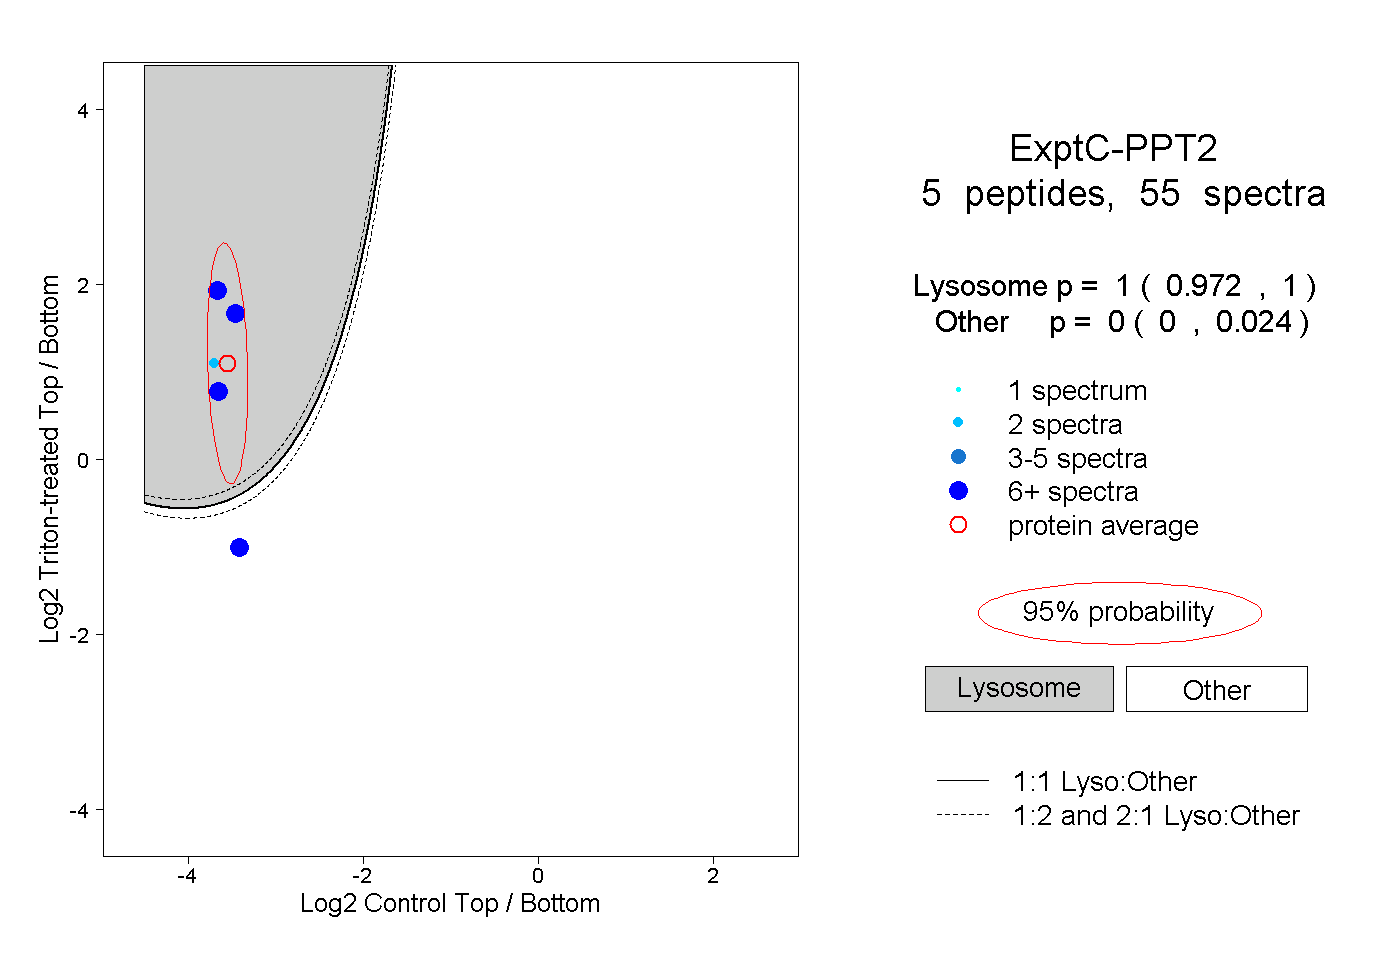
0.972 | 1.000
0.000 | 0.024