 4
4peptides
spectra
0.000 | 0.000
0.712 | 0.892
0.021 | 0.217
0.000 | 0.000
0.000 | 0.000
0.000 | 0.000
0.012 | 0.098
0.000 | 0.000
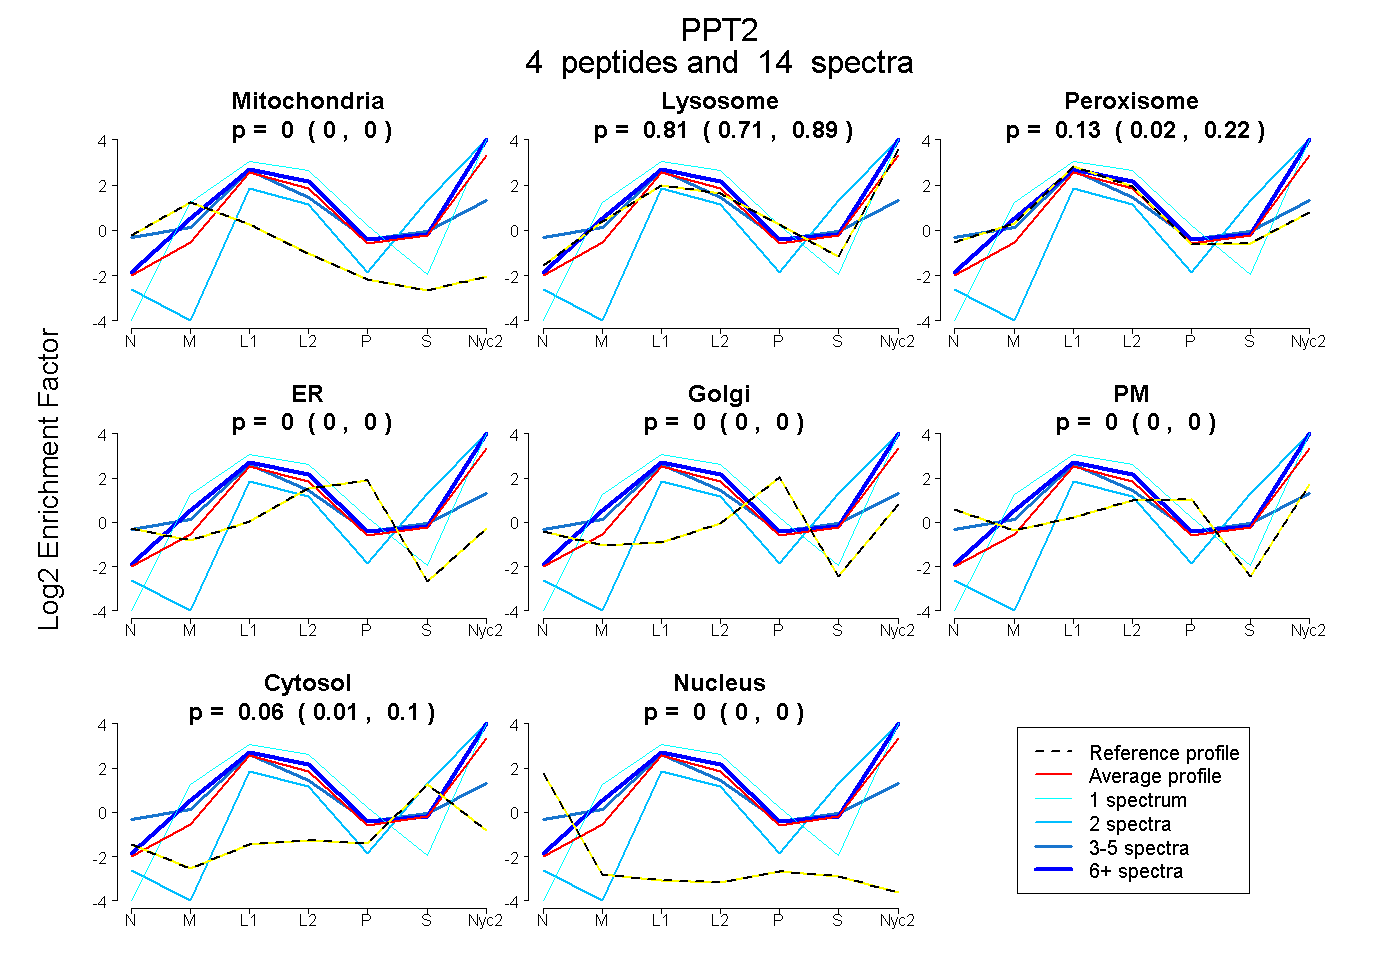
| Plot | Mito | Lyso | Perox | ER | Golgi | PM | Cytosol | Nucleus | |||||
| Expt A |
4 peptides |
14 spectra |
|
0.000 0.000 | 0.000 |
0.807 0.712 | 0.892 |
0.135 0.021 | 0.217 |
0.000 0.000 | 0.000 |
0.000 0.000 | 0.000 |
0.000 0.000 | 0.000 |
0.058 0.012 | 0.098 |
0.000 0.000 | 0.000 |
| 7 spectra, ESLRPLWEQVQGFR | 0.000 | 0.969 | 0.031 | 0.000 | 0.000 | 0.000 | 0.000 | 0.000 | ||
| 1 spectrum, WLFPTSMR | 0.000 | 1.000 | 0.000 | 0.000 | 0.000 | 0.000 | 0.000 | 0.000 | ||
| 2 spectra, EAVVPIMEK | 0.000 | 0.609 | 0.000 | 0.000 | 0.000 | 0.000 | 0.391 | 0.000 | ||
| 4 spectra, APEGVHLICYSQGGLVCR | 0.000 | 0.133 | 0.805 | 0.000 | 0.000 | 0.000 | 0.062 | 0.000 |
| Plot | Mito | Lyso or Perox | ER | Golgi | PM | Cytosol | Nucleus | ||||||
| Expt B |
2 peptides |
8 spectra |
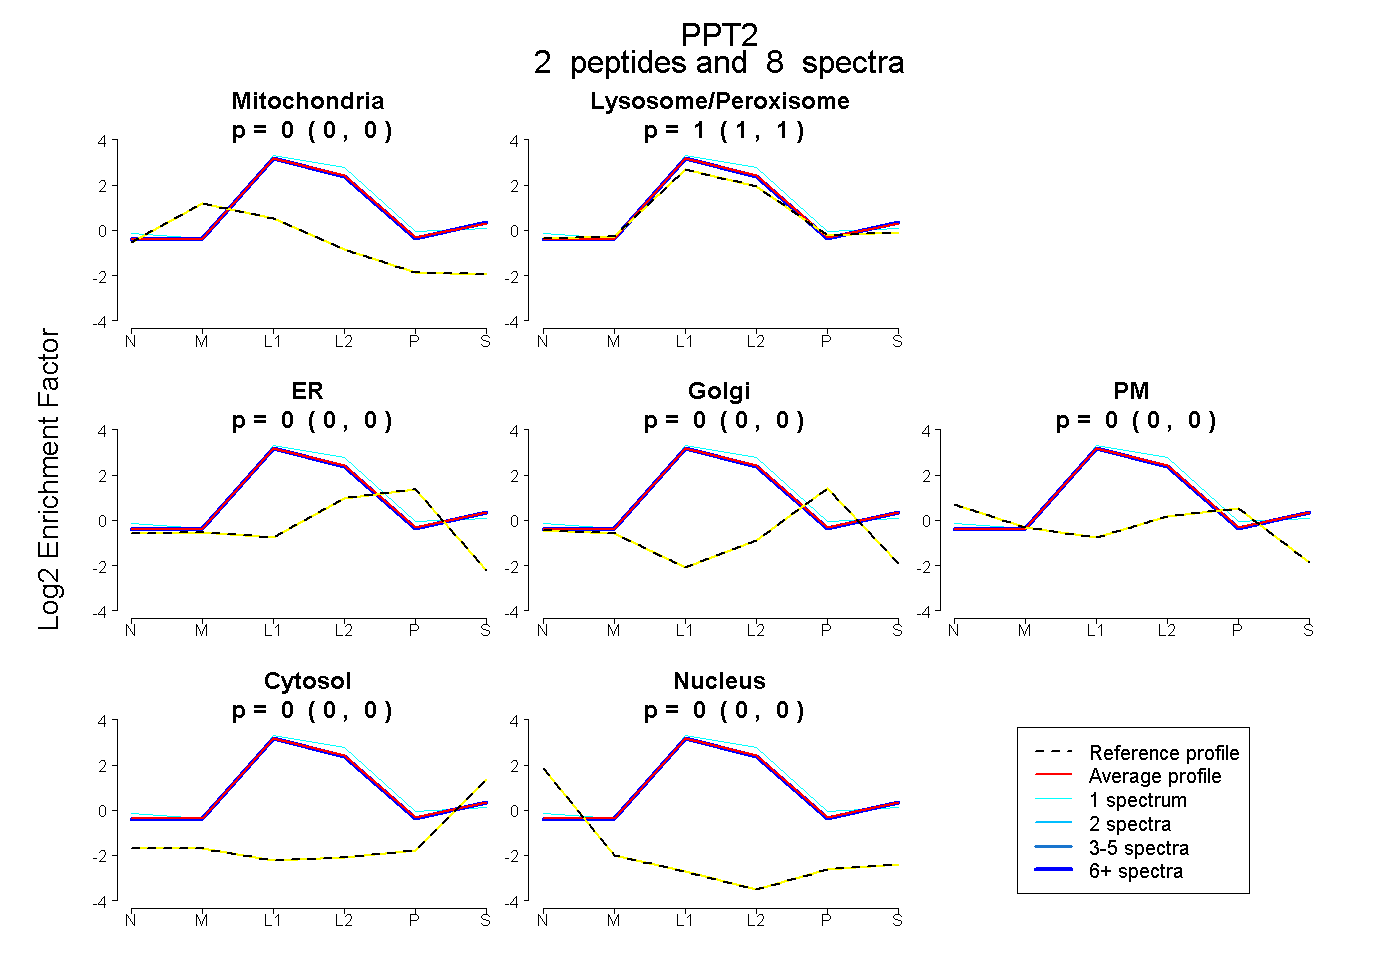 |
0.000 0.000 | 0.000 |
1.000 1.000 | 1.000 |
0.000 0.000 | 0.000 |
0.000 0.000 | 0.000 |
0.000 0.000 | 0.000 |
0.000 0.000 | 0.000 |
0.000 0.000 | 0.000 |
|||
| Plot | Lyso | Other | |||||||||||
| Expt C |
5 peptides |
55 spectra |
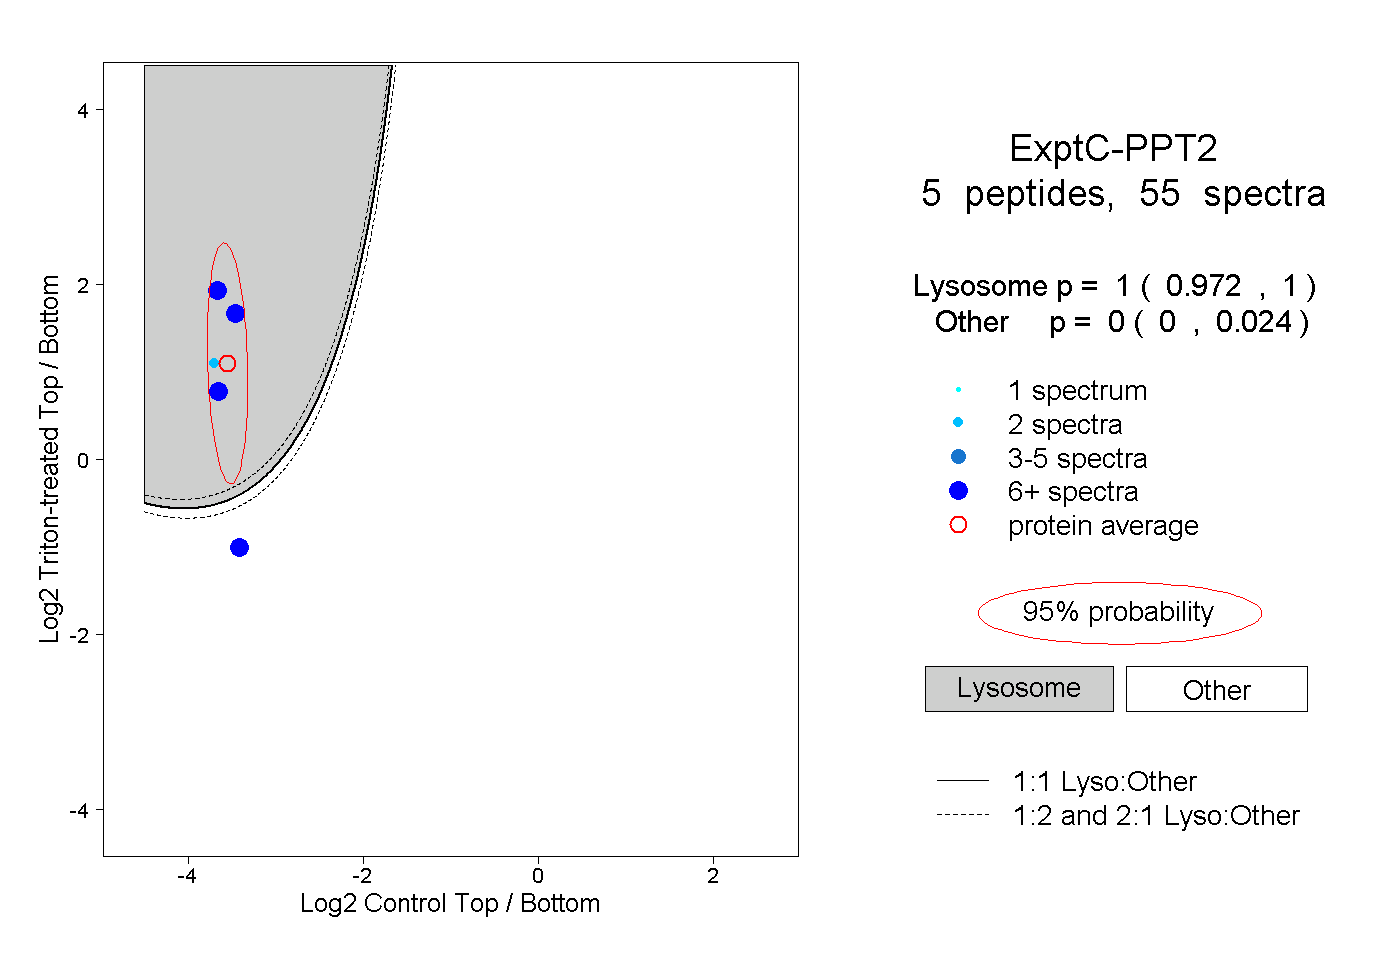 |
1.000 0.972 | 1.000 |
0.000 0.000 | 0.024 |