 4
4peptides
spectra
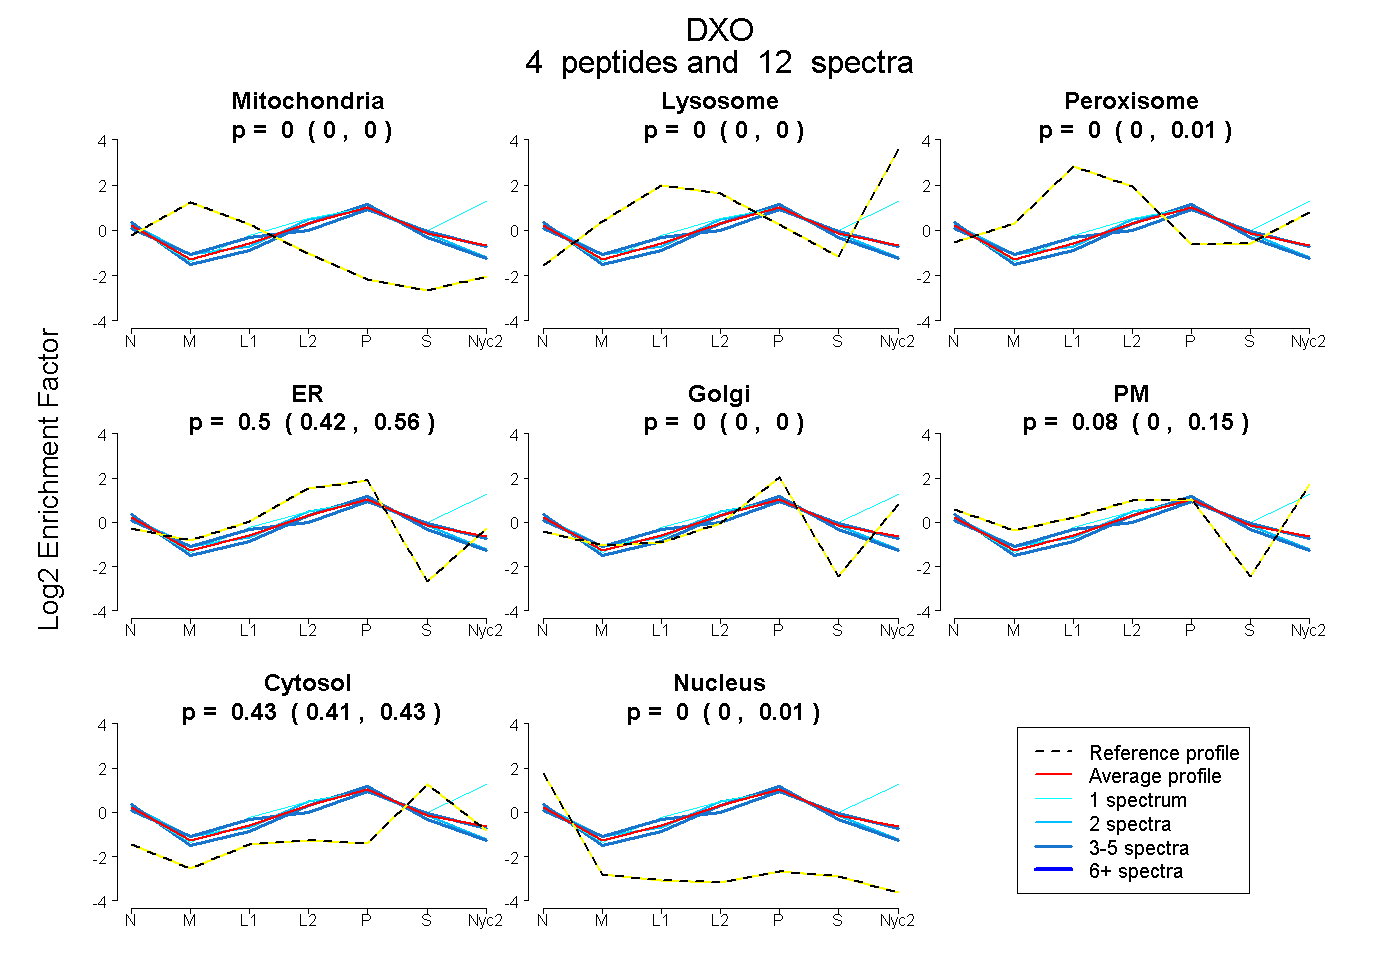
0.000 | 0.000
0.000 | 0.000
0.000 | 0.015
0.416 | 0.562
0.000 | 0.000
0.000 | 0.151
0.413 | 0.433
0.000 | 0.006
1peptide
spectra
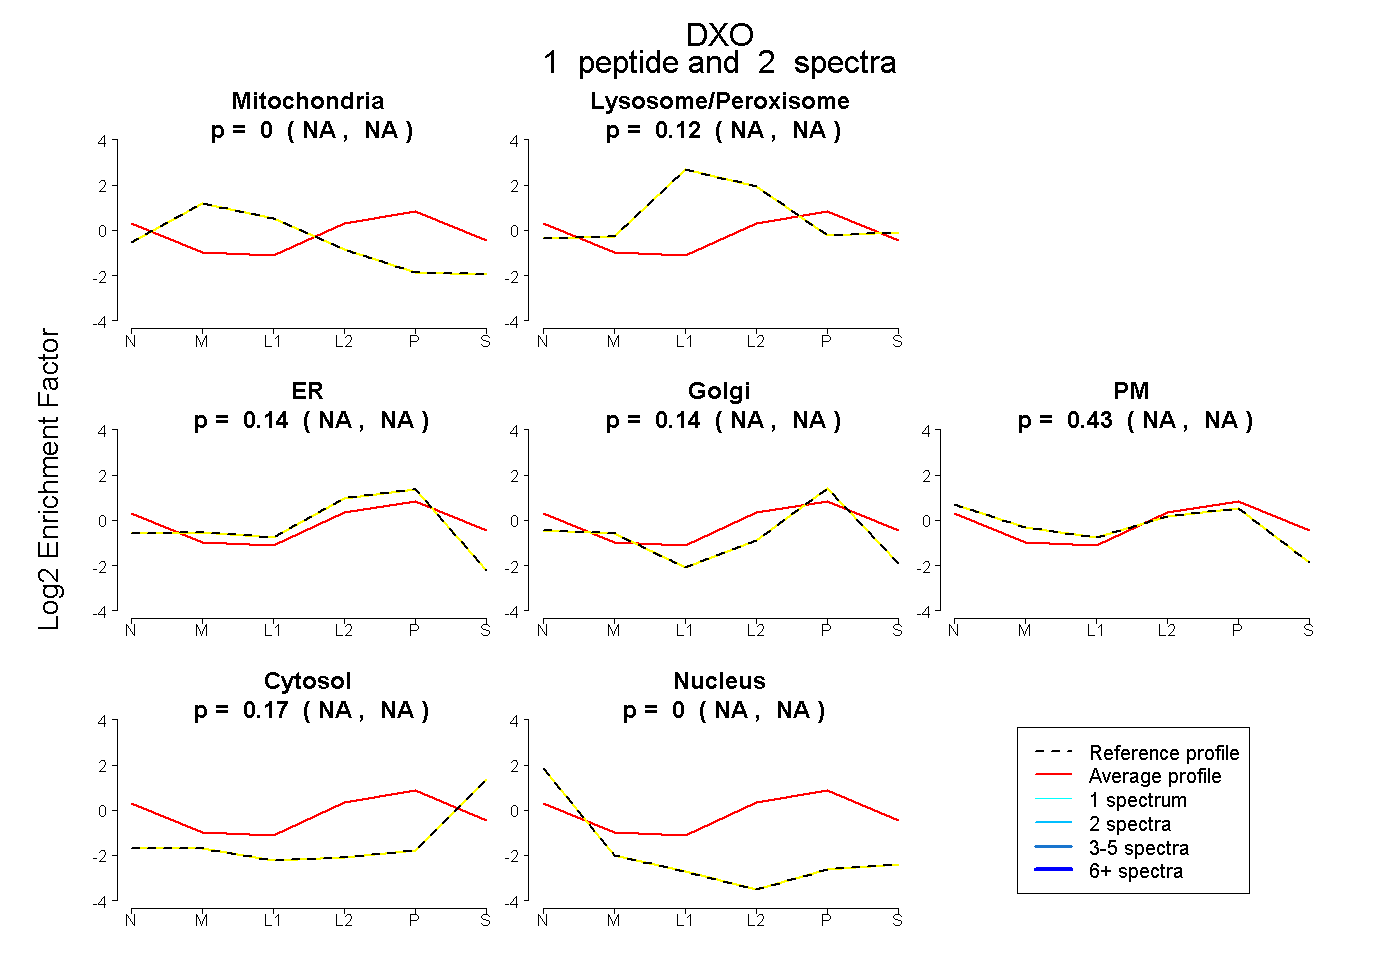
NA | NA
NA | NA
NA | NA
NA | NA
NA | NA
NA | NA
NA | NA
3peptides
spectra
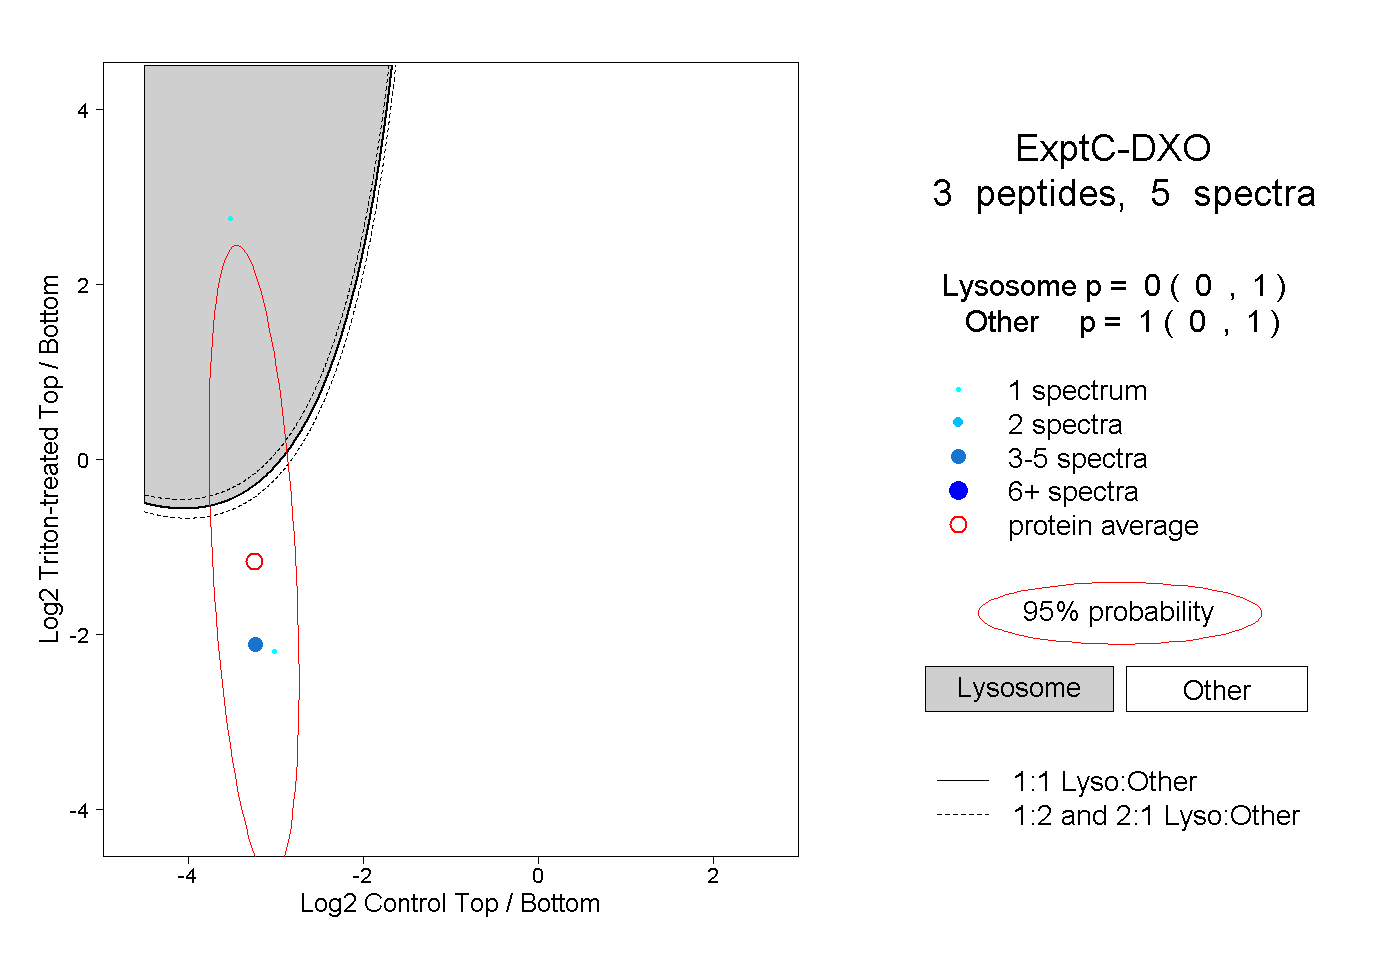
0.000 | 1.000
0.000 | 1.000
1peptide
spectrum
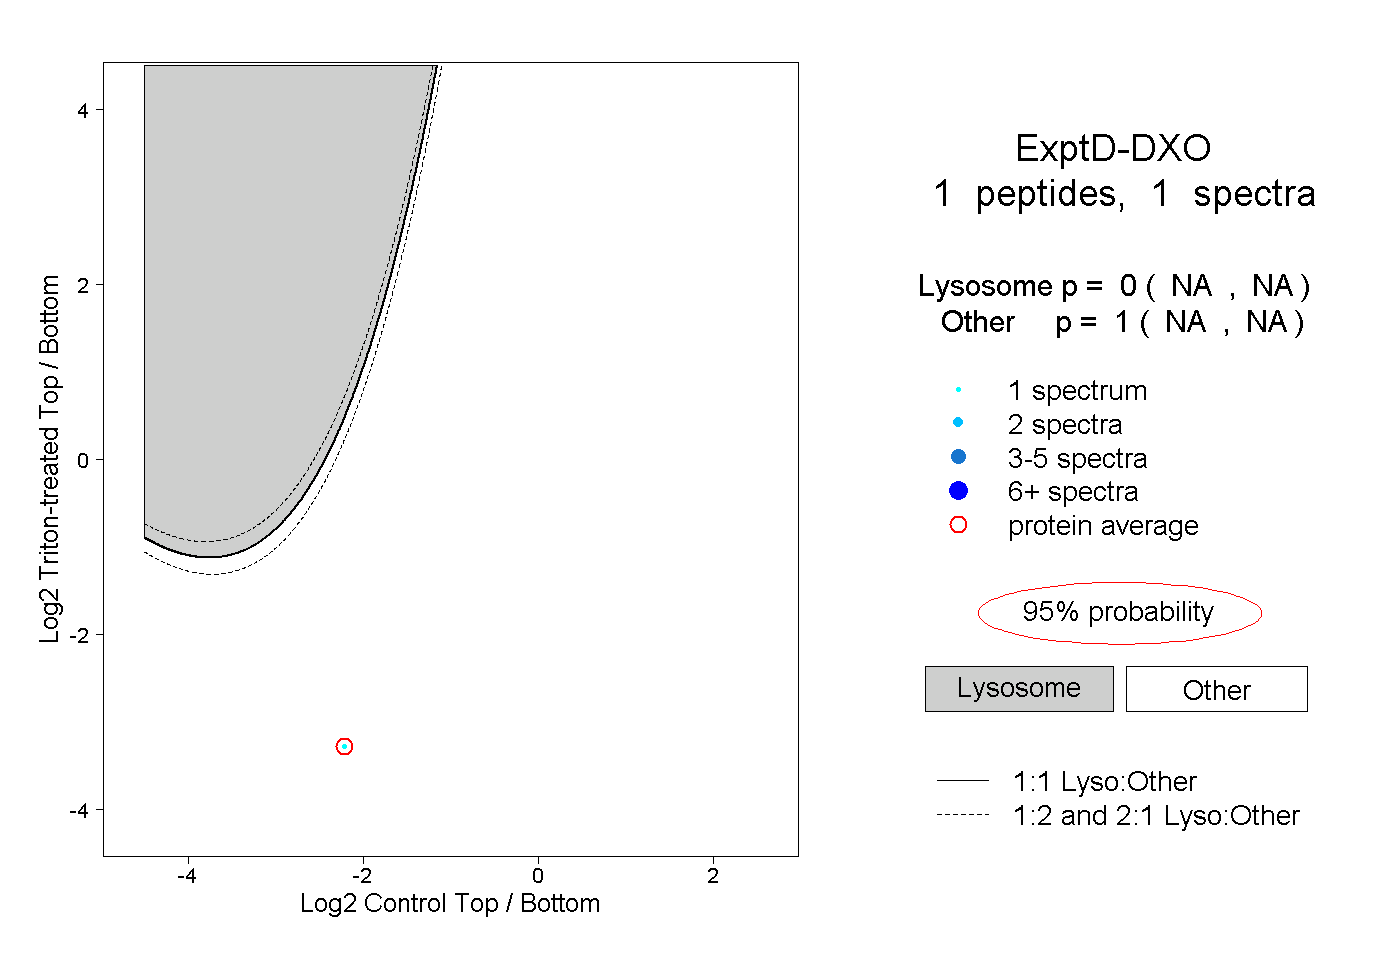
NA | NA
NA | NA