 4
4peptides
spectra
0.000 | 0.000
0.000 | 0.000
0.000 | 0.015
0.416 | 0.562
0.000 | 0.000
0.000 | 0.151
0.413 | 0.433
0.000 | 0.006
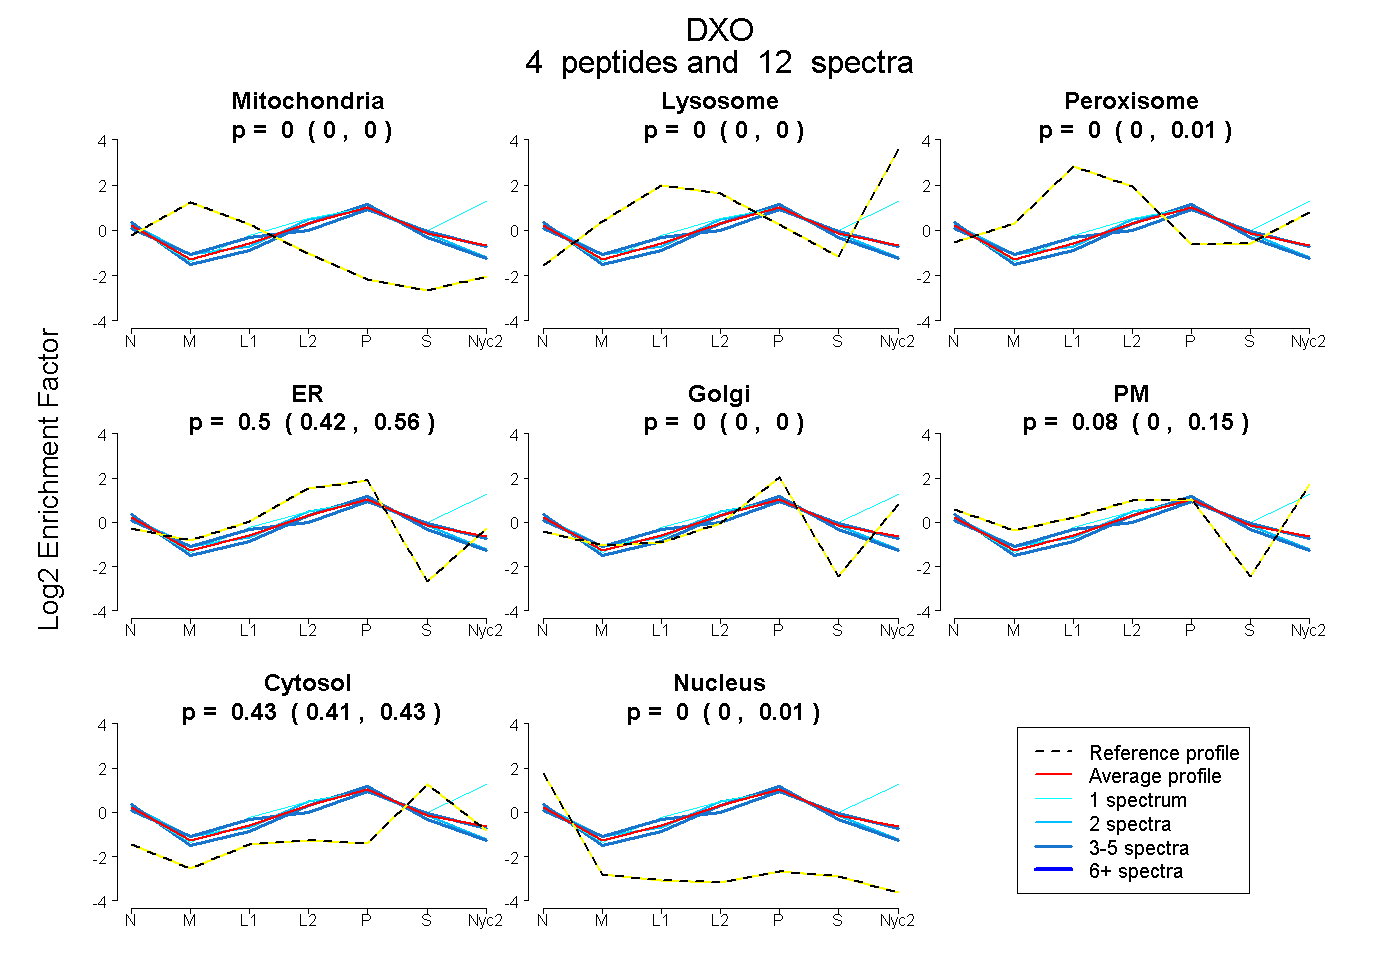
| Plot | Mito | Lyso | Perox | ER | Golgi | PM | Cytosol | Nucleus | |||||
| Expt A |
4 peptides |
12 spectra |
|
0.000 0.000 | 0.000 |
0.000 0.000 | 0.000 |
0.000 0.000 | 0.015 |
0.499 0.416 | 0.562 |
0.000 0.000 | 0.000 |
0.075 0.000 | 0.151 |
0.425 0.413 | 0.433 |
0.000 0.000 | 0.006 |
| 1 spectrum, LDHLLR | 0.000 | 0.104 | 0.000 | 0.000 | 0.031 | 0.523 | 0.343 | 0.000 | ||
| 2 spectra, DGYPDR | 0.000 | 0.000 | 0.016 | 0.557 | 0.000 | 0.000 | 0.400 | 0.028 | ||
| 4 spectra, WVLEHR | 0.000 | 0.000 | 0.083 | 0.417 | 0.073 | 0.000 | 0.419 | 0.008 | ||
| 5 spectra, LARPPLLR | 0.000 | 0.000 | 0.000 | 0.563 | 0.000 | 0.000 | 0.375 | 0.062 |
| Plot | Mito | Lyso or Perox | ER | Golgi | PM | Cytosol | Nucleus | ||||||
| Expt B |
1 peptide |
2 spectra |
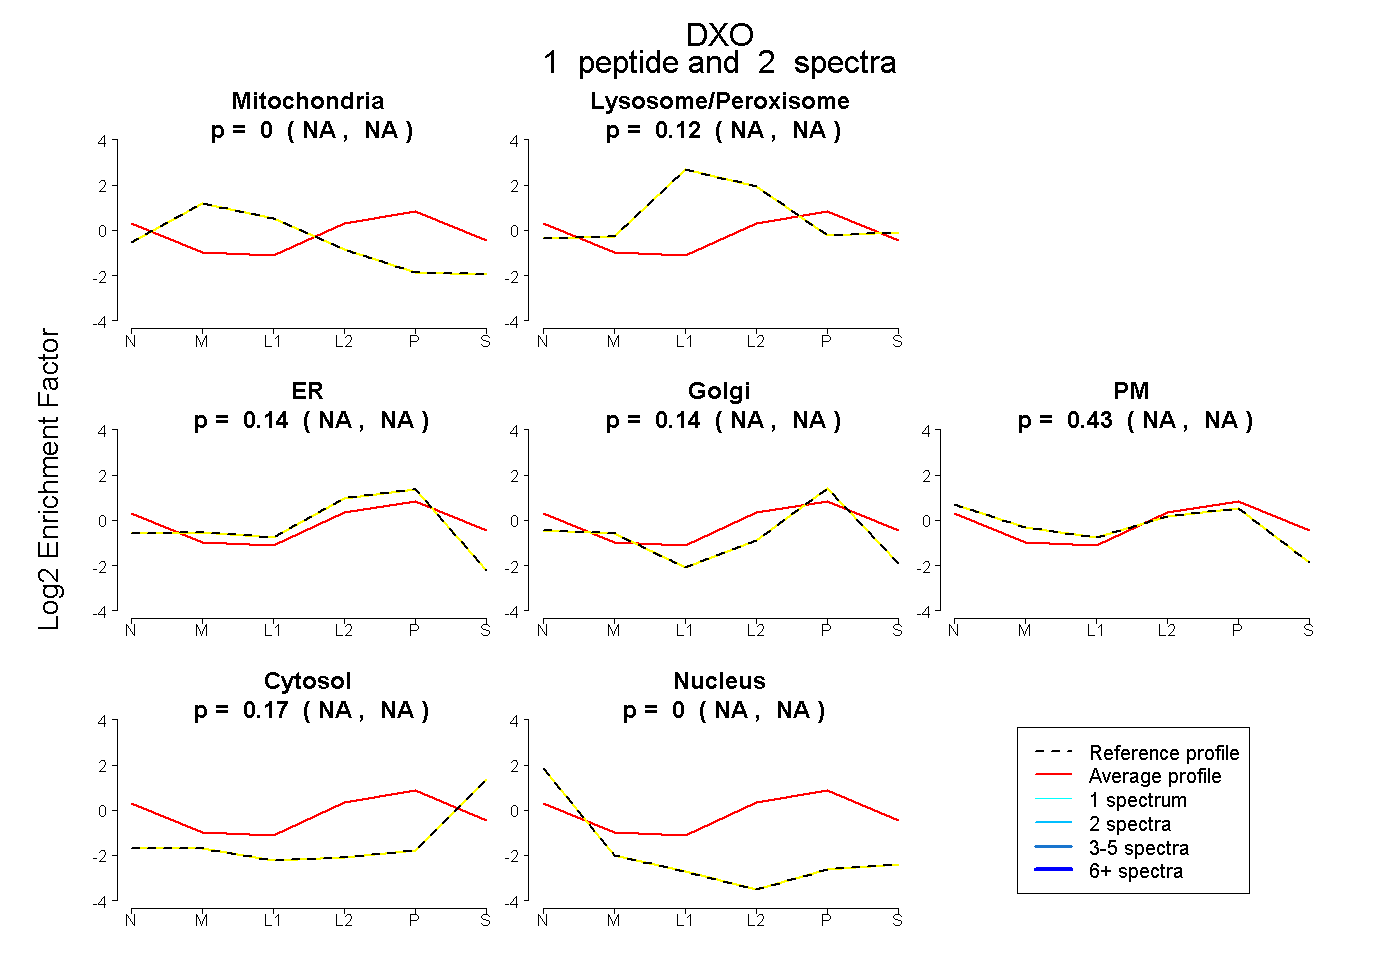 |
0.000 NA | NA |
0.116 NA | NA |
0.137 NA | NA |
0.145 NA | NA |
0.430 NA | NA |
0.172 NA | NA |
0.000 NA | NA |
|||
| Plot | Lyso | Other | |||||||||||
| Expt C |
3 peptides |
5 spectra |
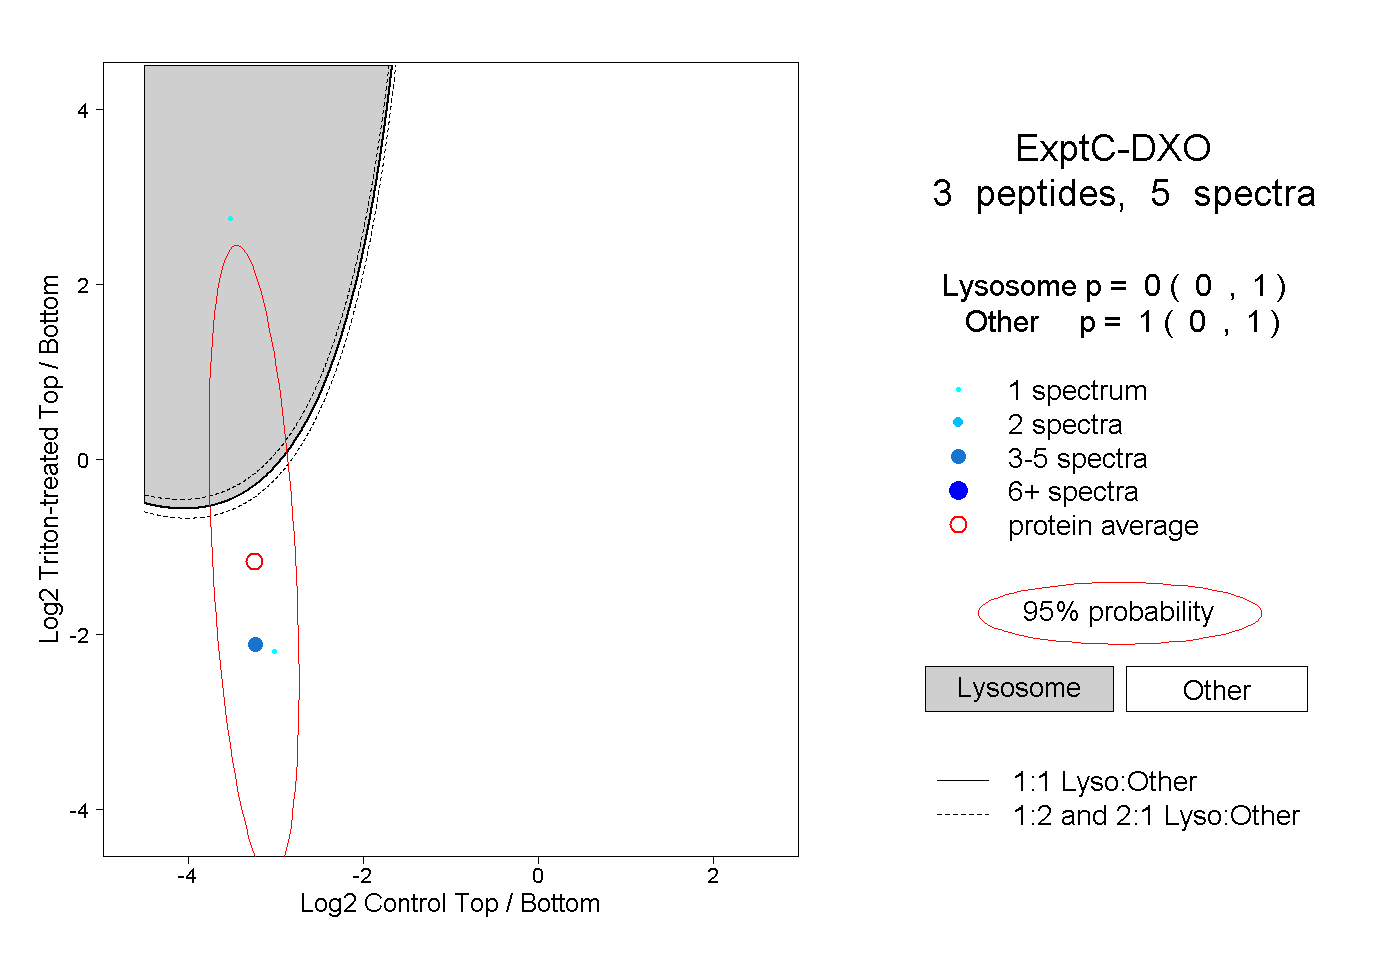 |
0.000 0.000 | 1.000 |
1.000 0.000 | 1.000 |
||||||||
| Plot | Lyso | Other | |||||||||||
| Expt D |
1 peptide |
1 spectrum |
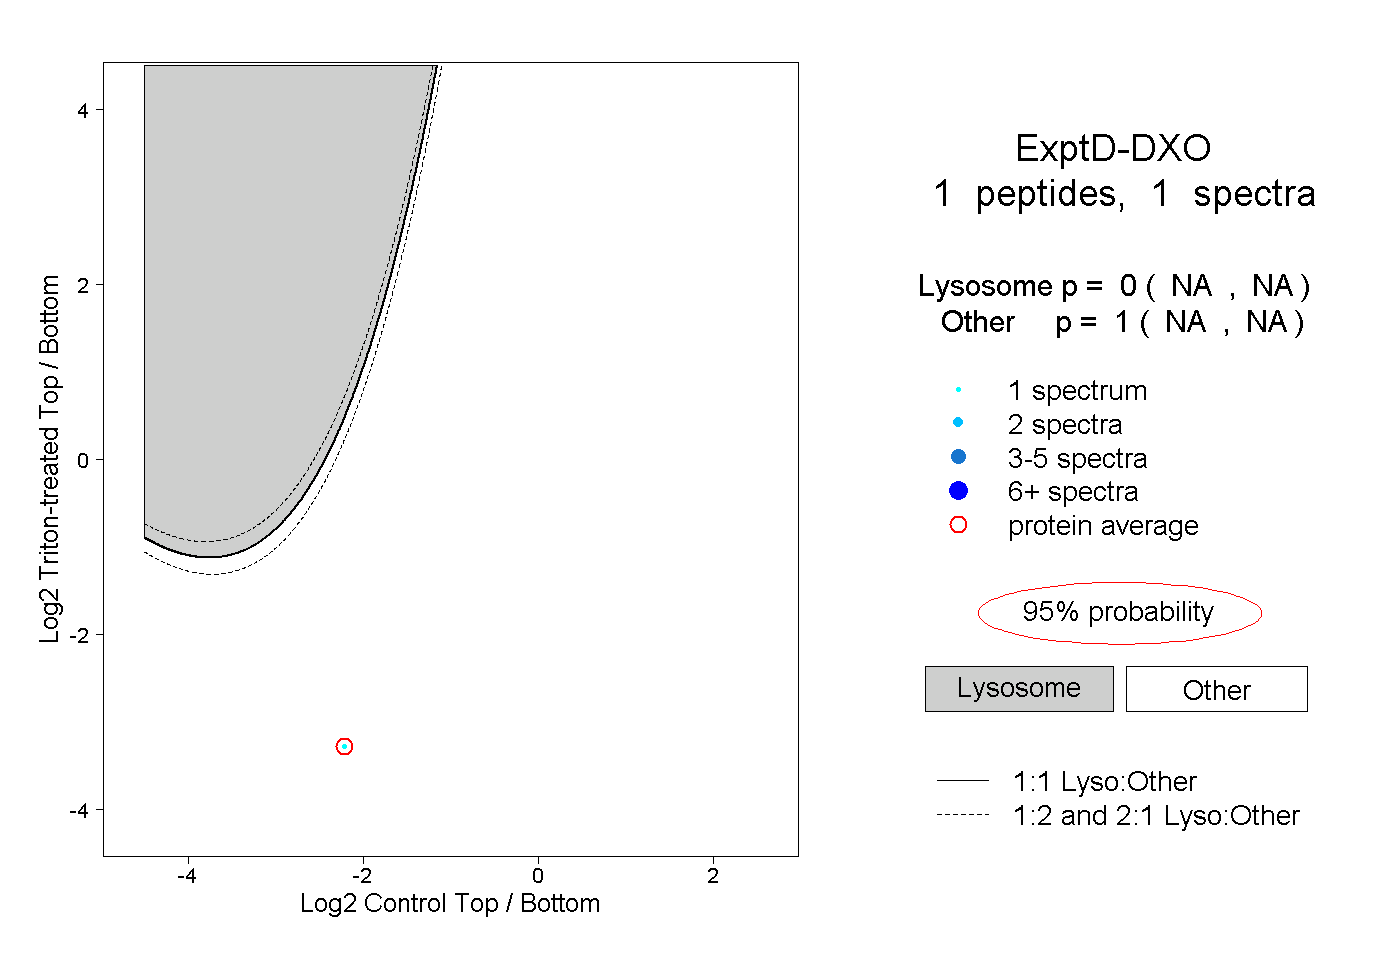 |
0.000 NA | NA |
1.000 NA | NA |