 12
12peptides
spectra
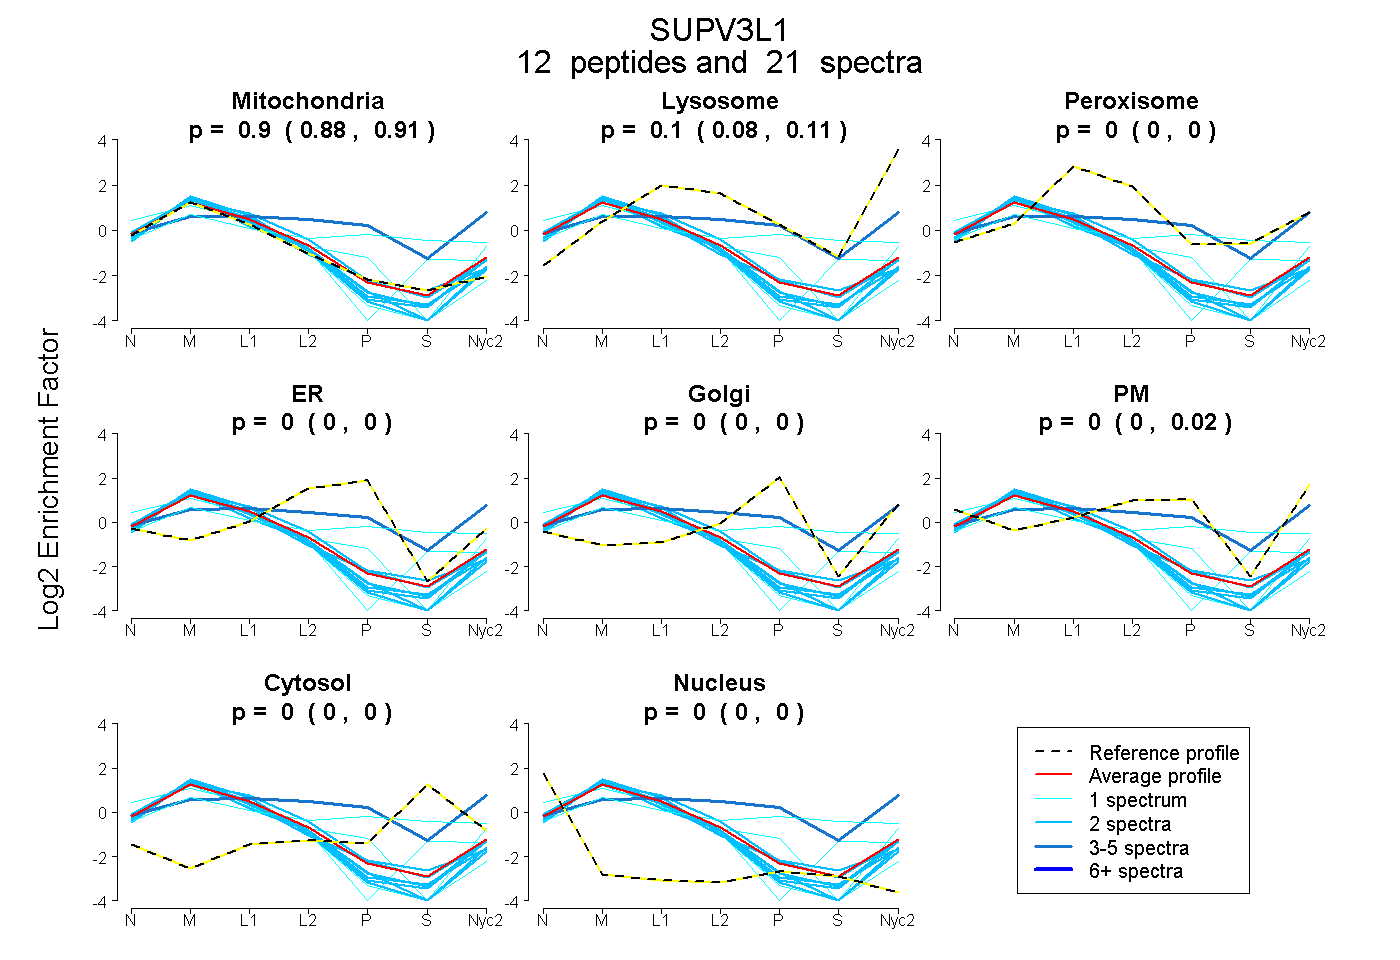
0.881 | 0.911
0.081 | 0.109
0.000 | 0.000
0.000 | 0.000
0.000 | 0.000
0.000 | 0.023
0.000 | 0.000
0.000 | 0.000
3peptides
spectra
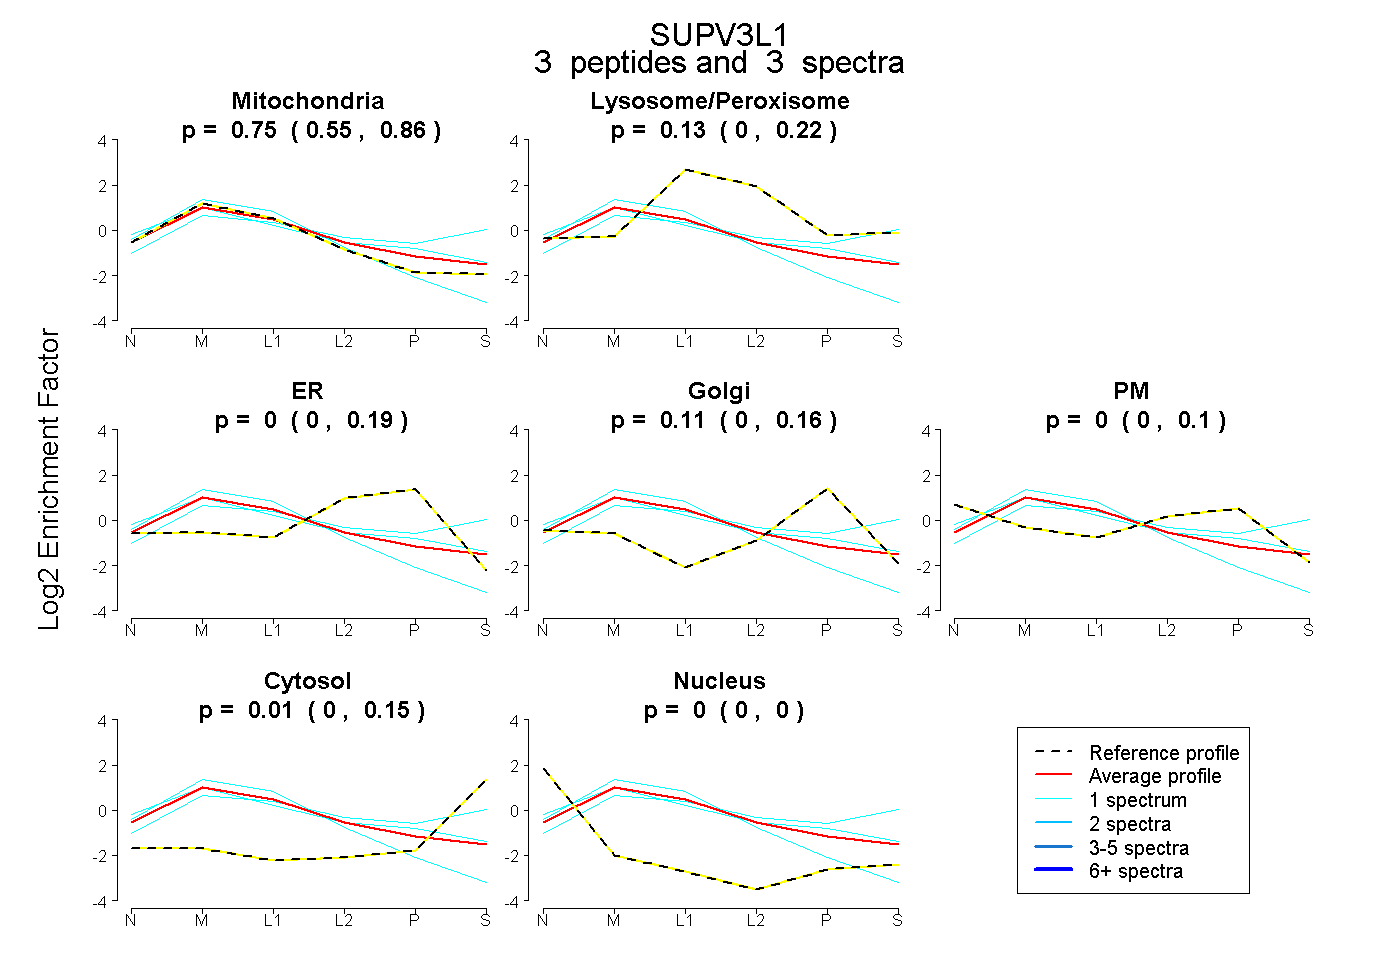
0.550 | 0.860
0.000 | 0.223
0.000 | 0.195
0.000 | 0.165
0.000 | 0.097
0.000 | 0.148
0.000 | 0.000
26peptides
spectra
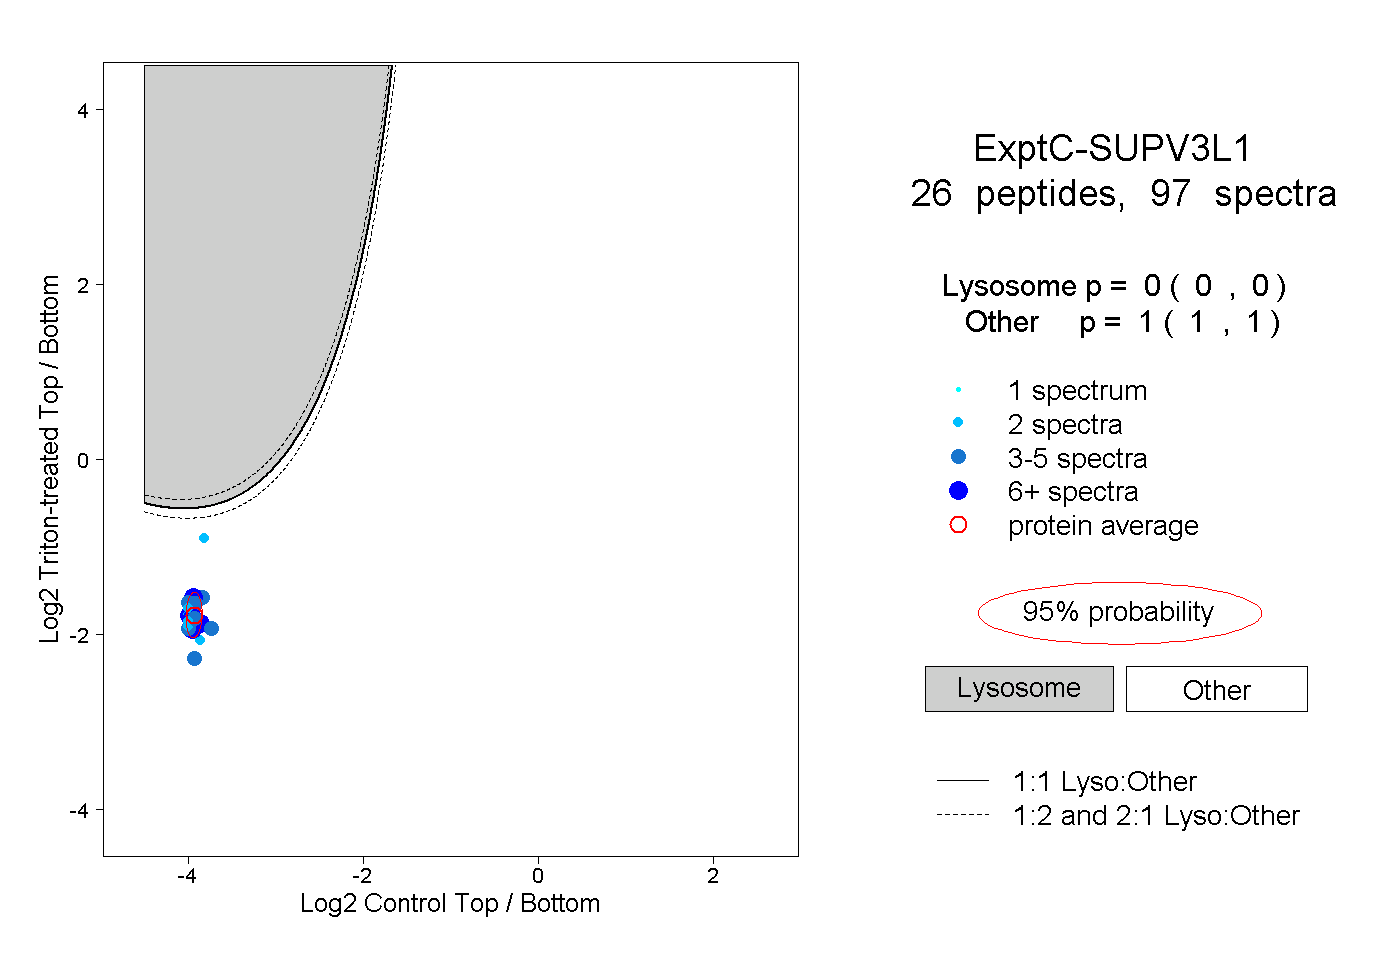
0.000 | 0.000
1.000 | 1.000
4peptides
spectra
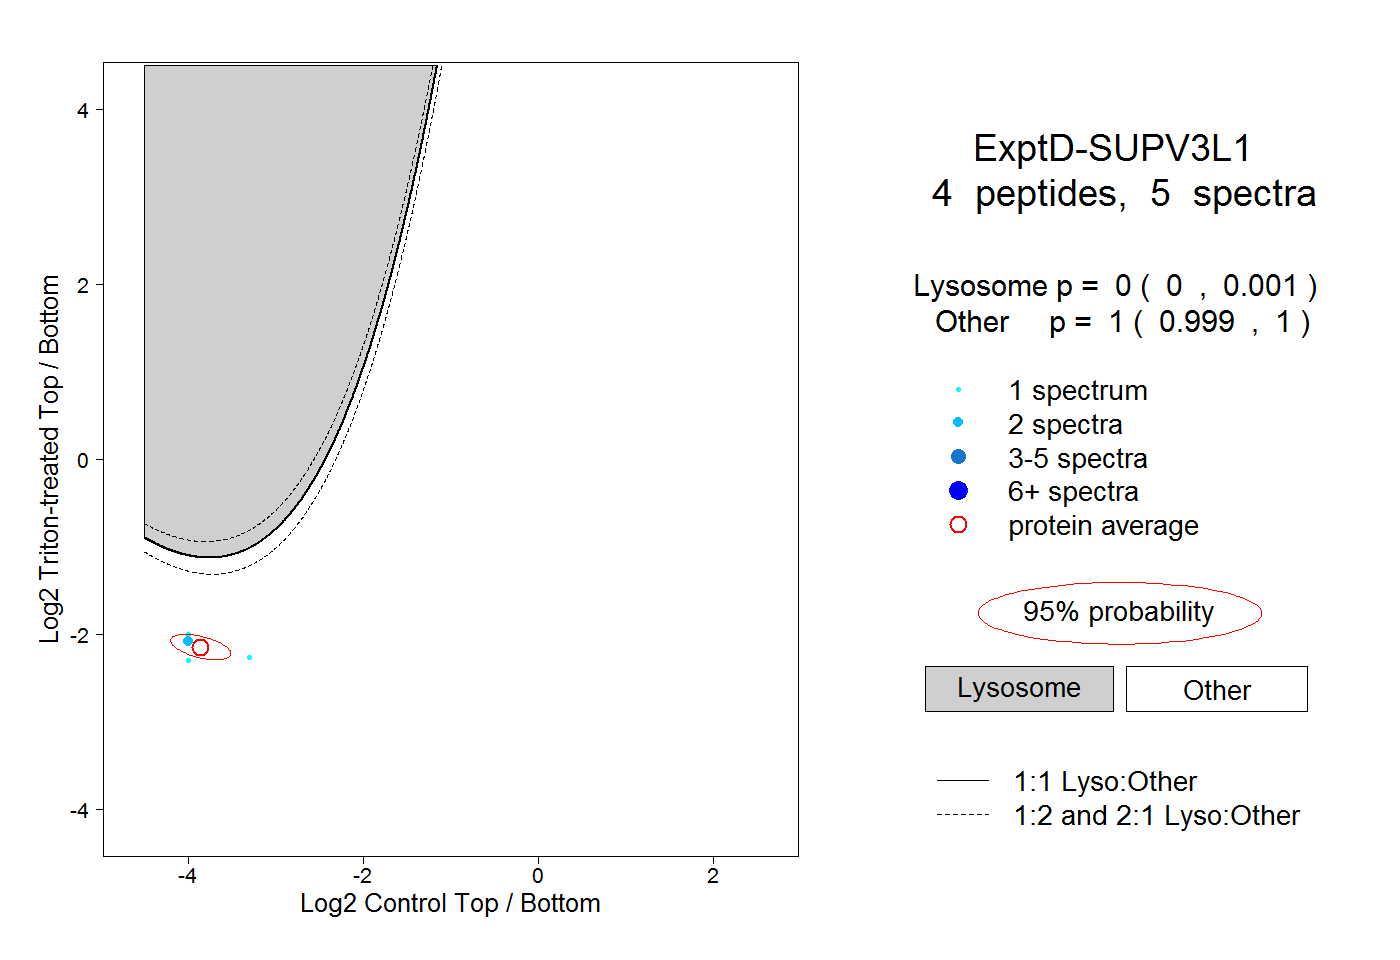
0.000 | 0.001
0.999 | 1.000