 12
12peptides
spectra
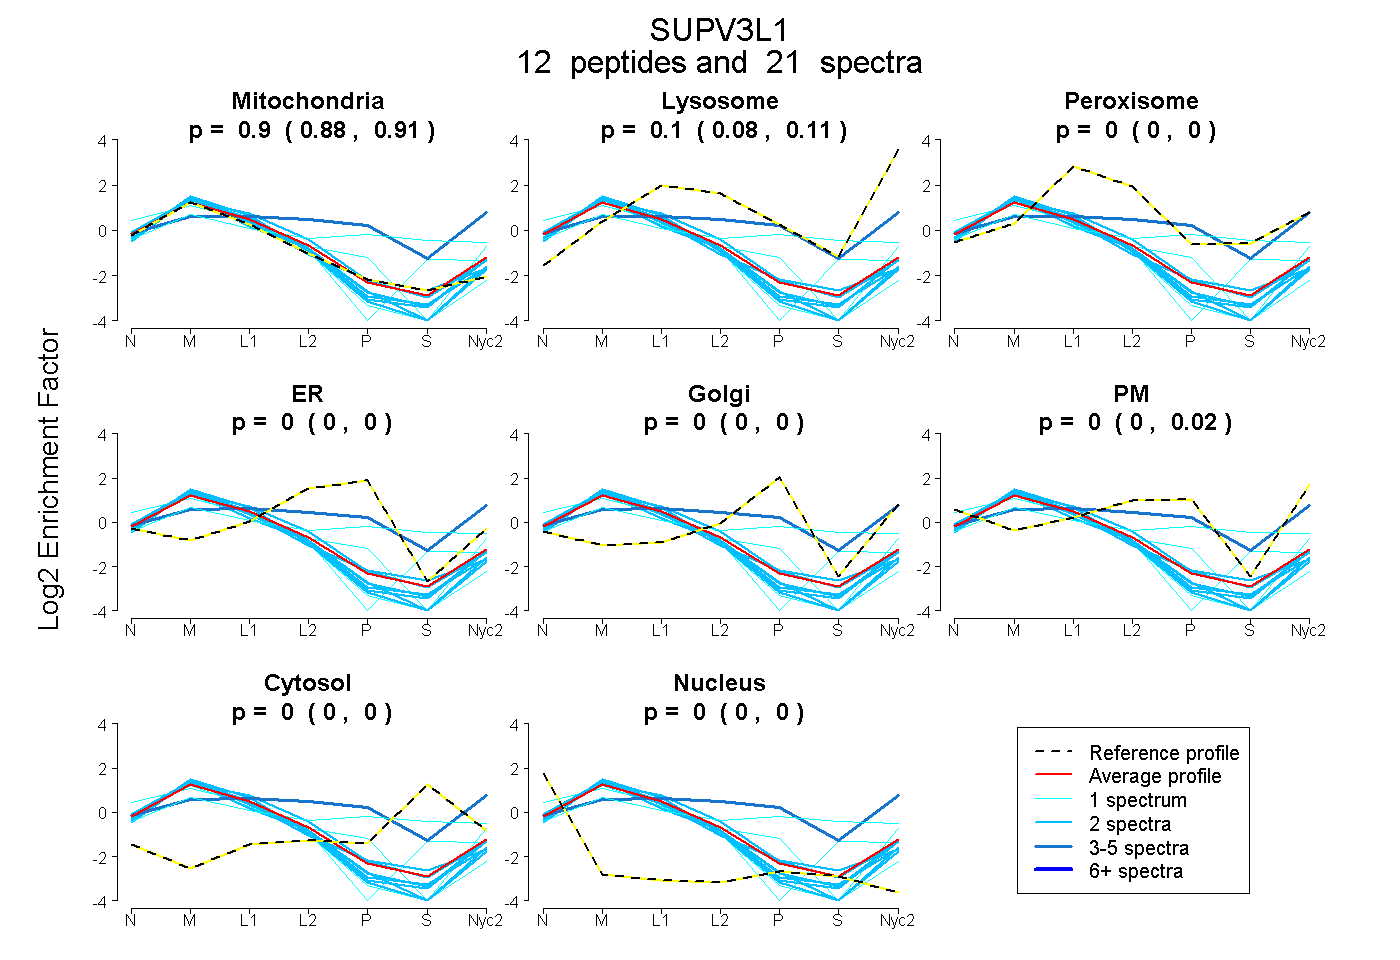
0.881 | 0.911
0.081 | 0.109
0.000 | 0.000
0.000 | 0.000
0.000 | 0.000
0.000 | 0.023
0.000 | 0.000
0.000 | 0.000
| Plot | Mito | Lyso | Perox | ER | Golgi | PM | Cytosol | Nucleus | |||||
| Expt A |
12 peptides |
21 spectra |
|
0.900 0.881 | 0.911 |
0.100 0.081 | 0.109 |
0.000 0.000 | 0.000 |
0.000 0.000 | 0.000 |
0.000 0.000 | 0.000 |
0.000 0.000 | 0.023 |
0.000 0.000 | 0.000 |
0.000 0.000 | 0.000 |
| 1 spectrum, WPLLPPK | 0.321 | 0.005 | 0.254 | 0.000 | 0.205 | 0.000 | 0.215 | 0.000 | ||
| 2 spectra, LTPISVLDR | 1.000 | 0.000 | 0.000 | 0.000 | 0.000 | 0.000 | 0.000 | 0.000 | ||
| 3 spectra, RPPNWYPEAR | 0.208 | 0.147 | 0.207 | 0.000 | 0.140 | 0.252 | 0.044 | 0.000 | ||
| 2 spectra, GWAWTR | 1.000 | 0.000 | 0.000 | 0.000 | 0.000 | 0.000 | 0.000 | 0.000 | ||
| 2 spectra, EWLTQRPEQGK | 0.871 | 0.059 | 0.065 | 0.000 | 0.000 | 0.005 | 0.000 | 0.000 | ||
| 2 spectra, LLNLEPSGSQSR | 0.949 | 0.051 | 0.000 | 0.000 | 0.000 | 0.000 | 0.000 | 0.000 | ||
| 1 spectrum, ELEPITTSQALQIAGR | 1.000 | 0.000 | 0.000 | 0.000 | 0.000 | 0.000 | 0.000 | 0.000 | ||
| 2 spectra, LSADYGLDAR | 0.958 | 0.042 | 0.000 | 0.000 | 0.000 | 0.000 | 0.000 | 0.000 | ||
| 1 spectrum, DDLALLK | 0.707 | 0.000 | 0.000 | 0.000 | 0.000 | 0.293 | 0.000 | 0.000 | ||
| 2 spectra, NEPLTFAWLR | 0.979 | 0.021 | 0.000 | 0.000 | 0.000 | 0.000 | 0.000 | 0.000 | ||
| 2 spectra, FIDMFPDSSFVR | 0.996 | 0.004 | 0.000 | 0.000 | 0.000 | 0.000 | 0.000 | 0.000 | ||
| 1 spectrum, FSAELIQHIPLSLR | 0.846 | 0.000 | 0.031 | 0.000 | 0.000 | 0.000 | 0.122 | 0.000 |
| Plot | Mito | Lyso or Perox | ER | Golgi | PM | Cytosol | Nucleus | ||||||
| Expt B |
3 peptides |
3 spectra |
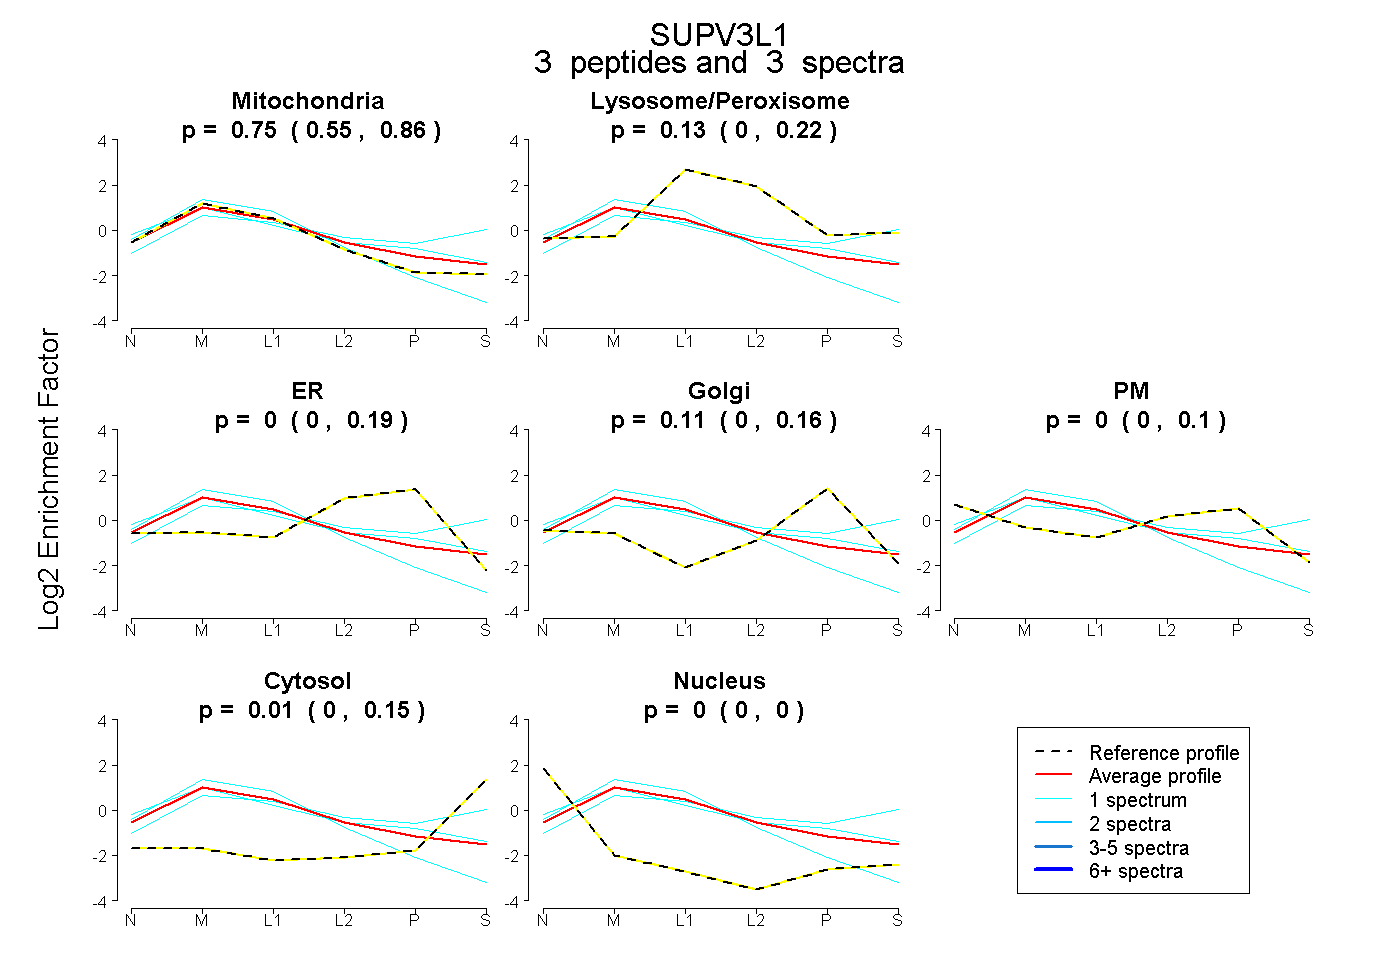 |
0.751 0.550 | 0.860 |
0.127 0.000 | 0.223 |
0.000 0.000 | 0.195 |
0.115 0.000 | 0.165 |
0.000 0.000 | 0.097 |
0.008 0.000 | 0.148 |
0.000 0.000 | 0.000 |
|||
| Plot | Lyso | Other | |||||||||||
| Expt C |
26 peptides |
97 spectra |
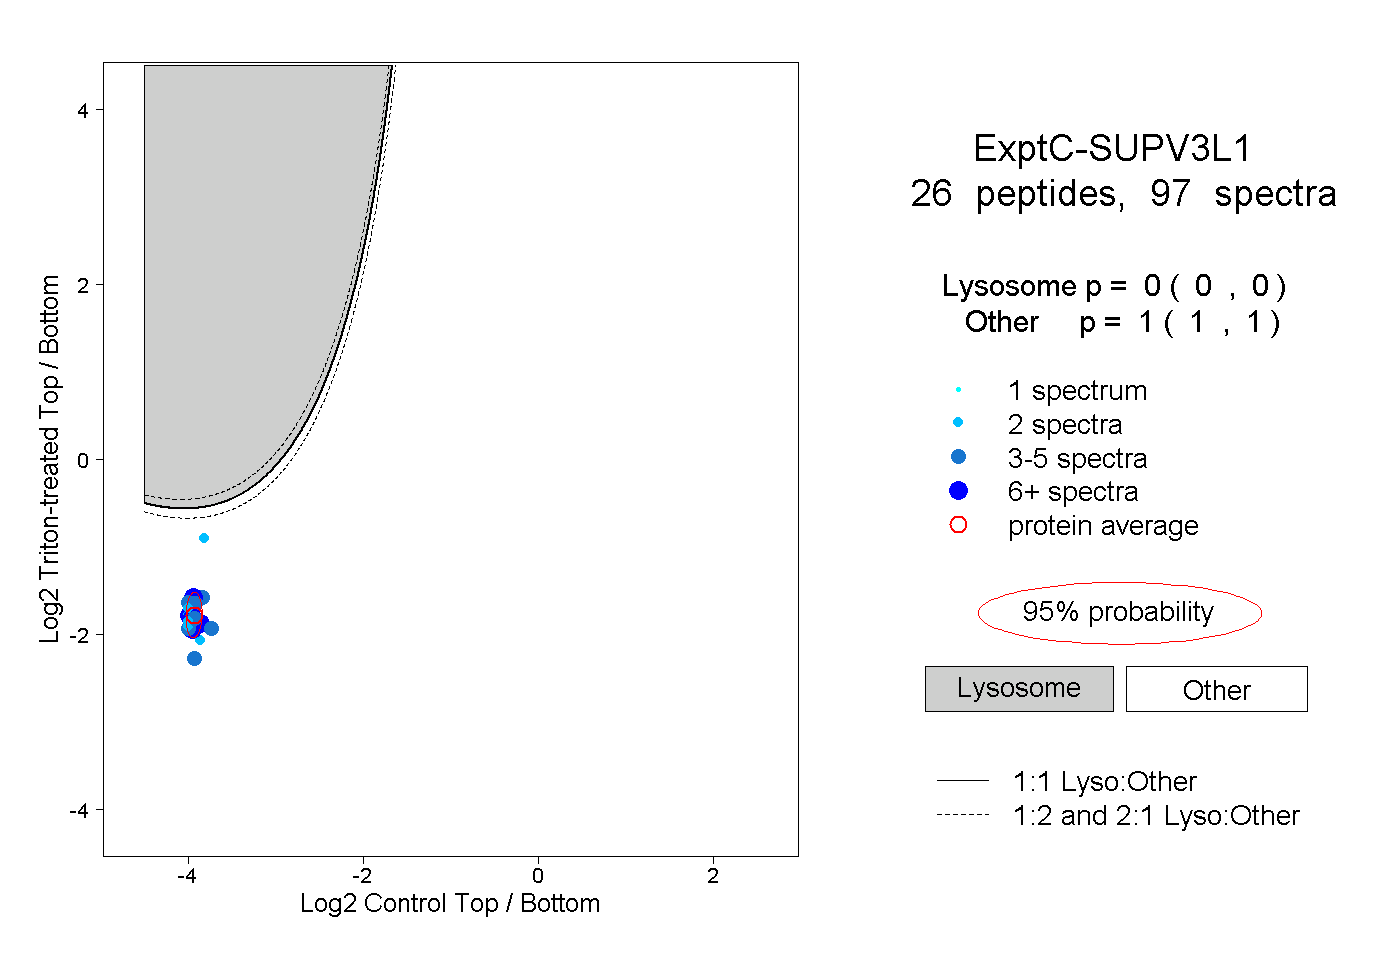 |
0.000 0.000 | 0.000 |
1.000 1.000 | 1.000 |
||||||||
| Plot | Lyso | Other | |||||||||||
| Expt D |
4 peptides |
5 spectra |
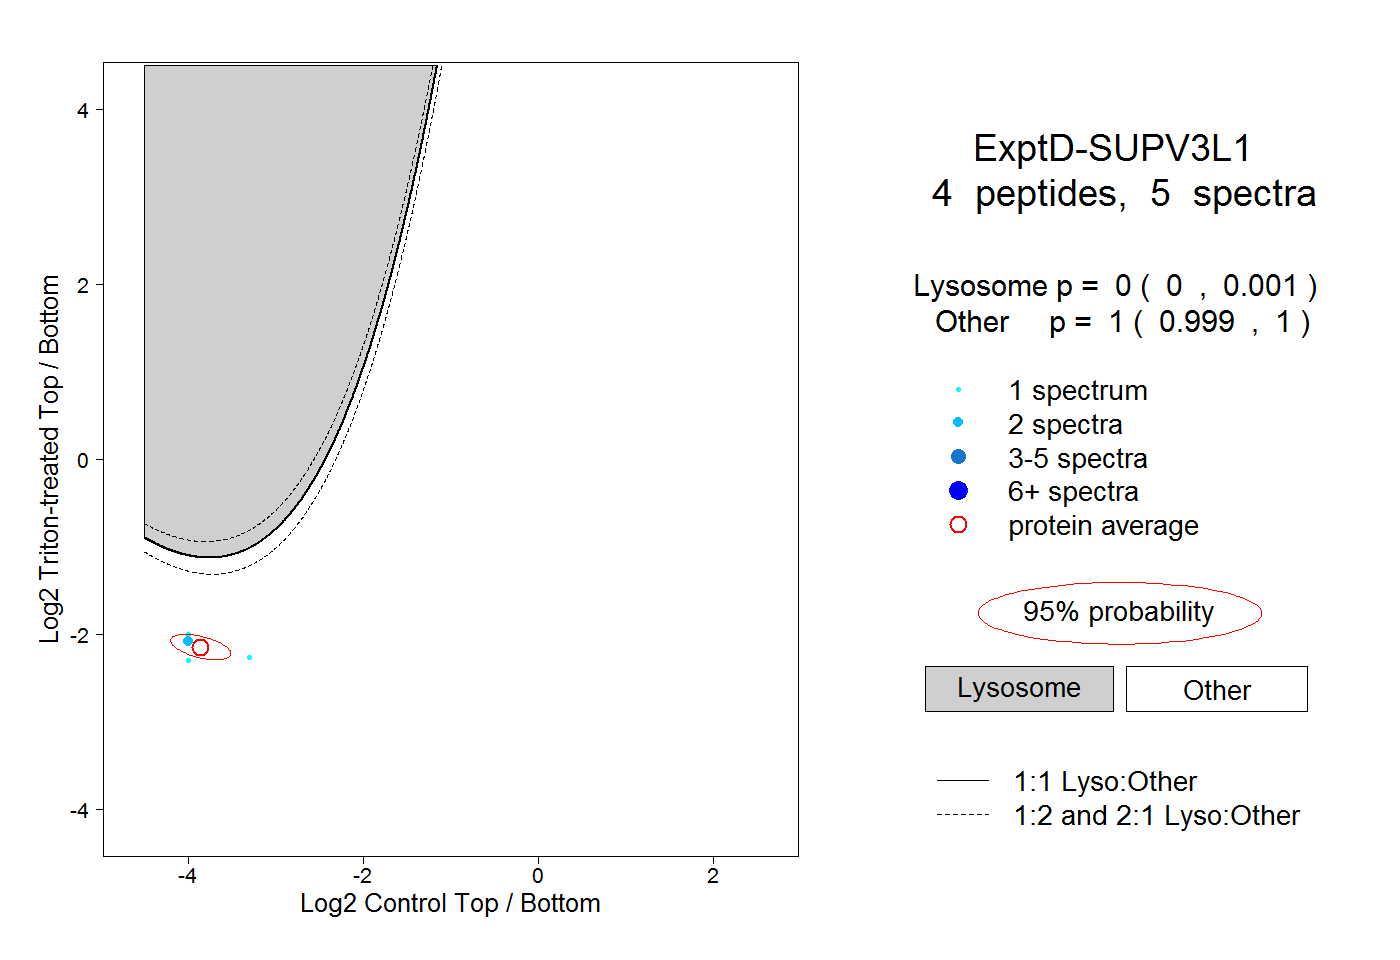 |
0.000 0.000 | 0.001 |
1.000 0.999 | 1.000 |