 3
3peptides
spectra
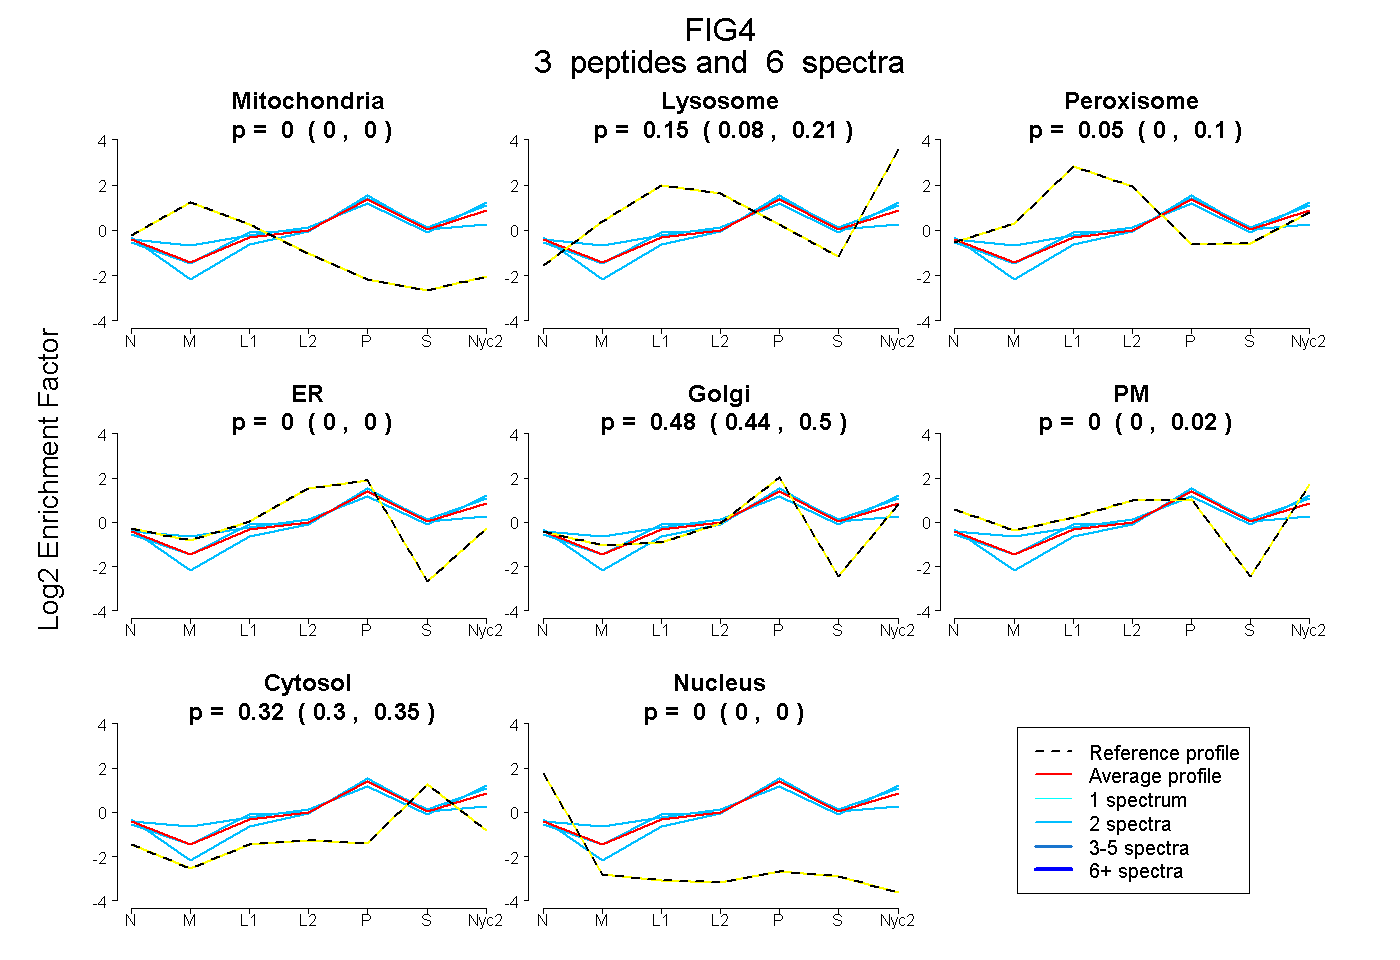
0.000 | 0.000
0.079 | 0.206
0.000 | 0.103
0.000 | 0.000
0.441 | 0.501
0.000 | 0.019
0.298 | 0.347
0.000 | 0.000
1peptide
spectra
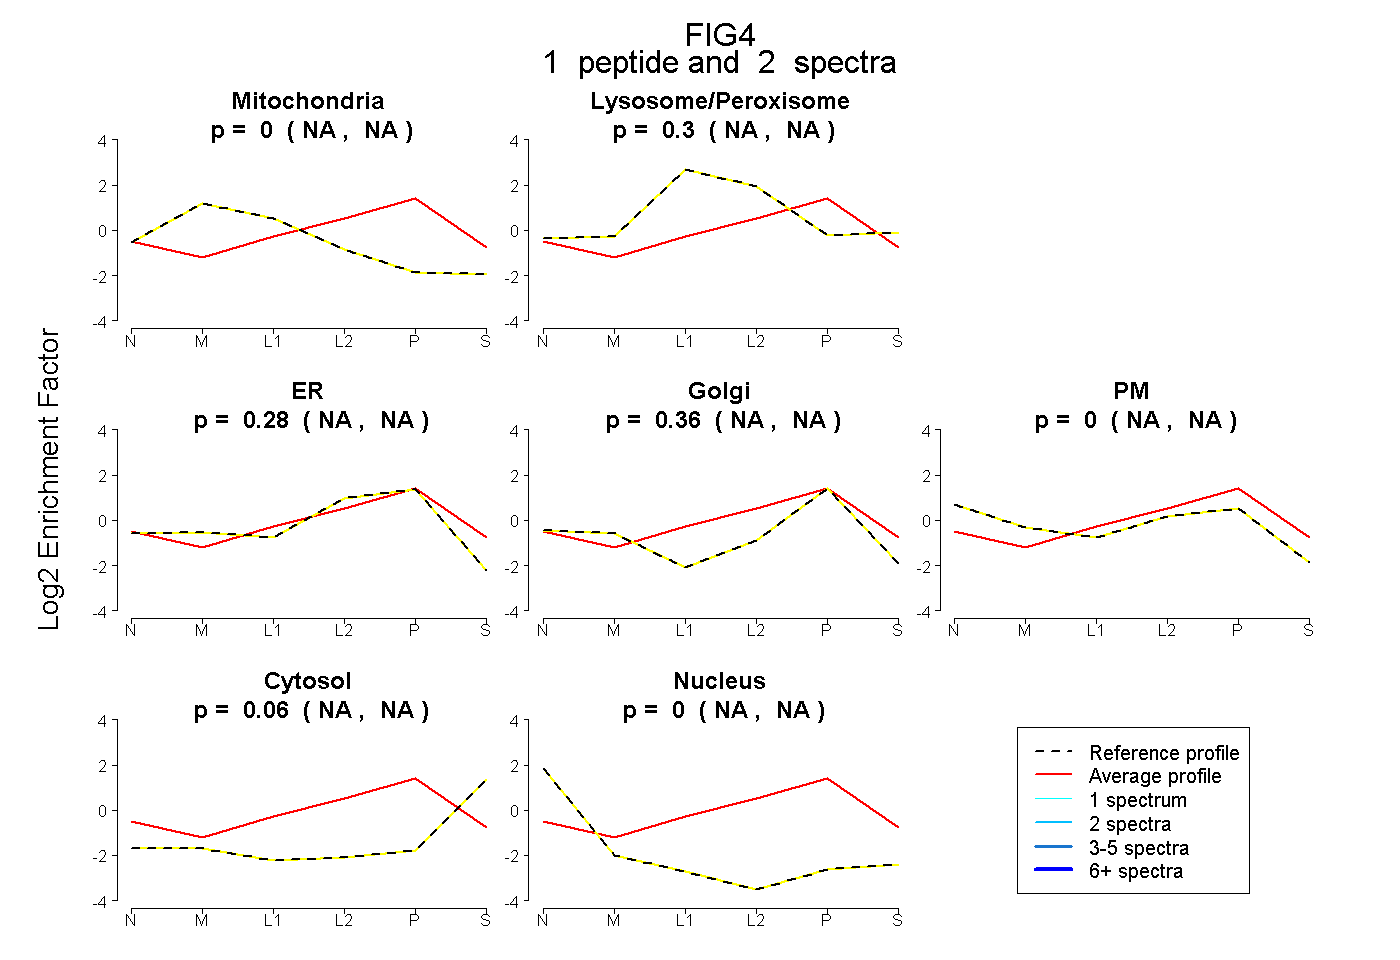
NA | NA
NA | NA
NA | NA
NA | NA
NA | NA
NA | NA
NA | NA
11peptides
spectra
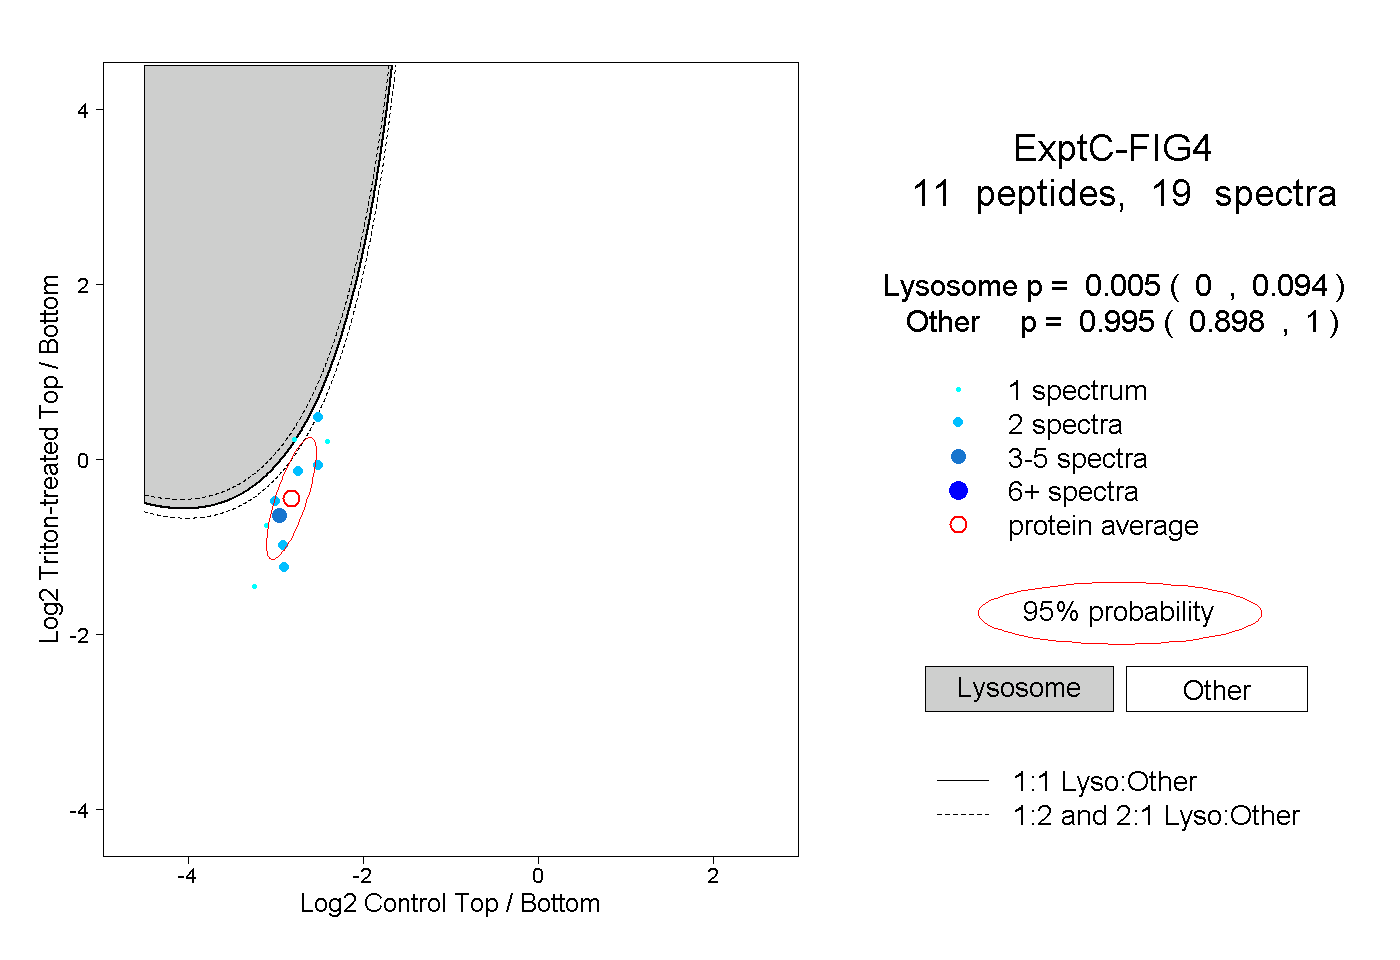
0.000 | 0.094
0.898 | 1.000
3peptides
spectra
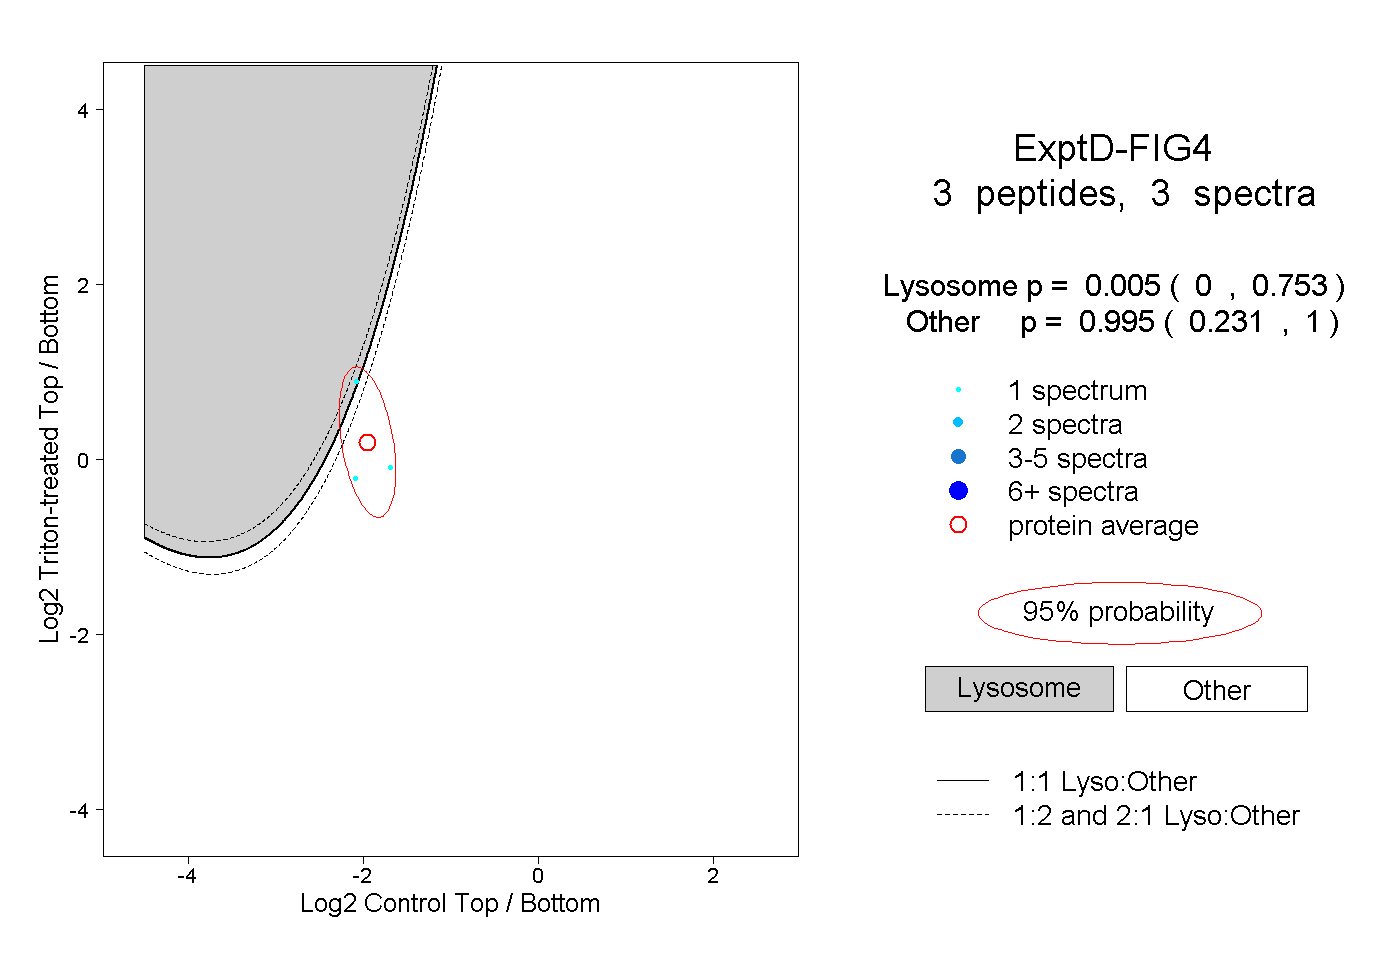
0.000 | 0.753
0.231 | 1.000