FIG4
[ENSRNOP00000000343]
Main page
| | | Plot |
Mito |
Lyso |
|
Perox |
ER |
Golgi |
PM |
Cytosol |
Nucleus |
|
| Expt A |
 3
3
peptides |
6
spectra |
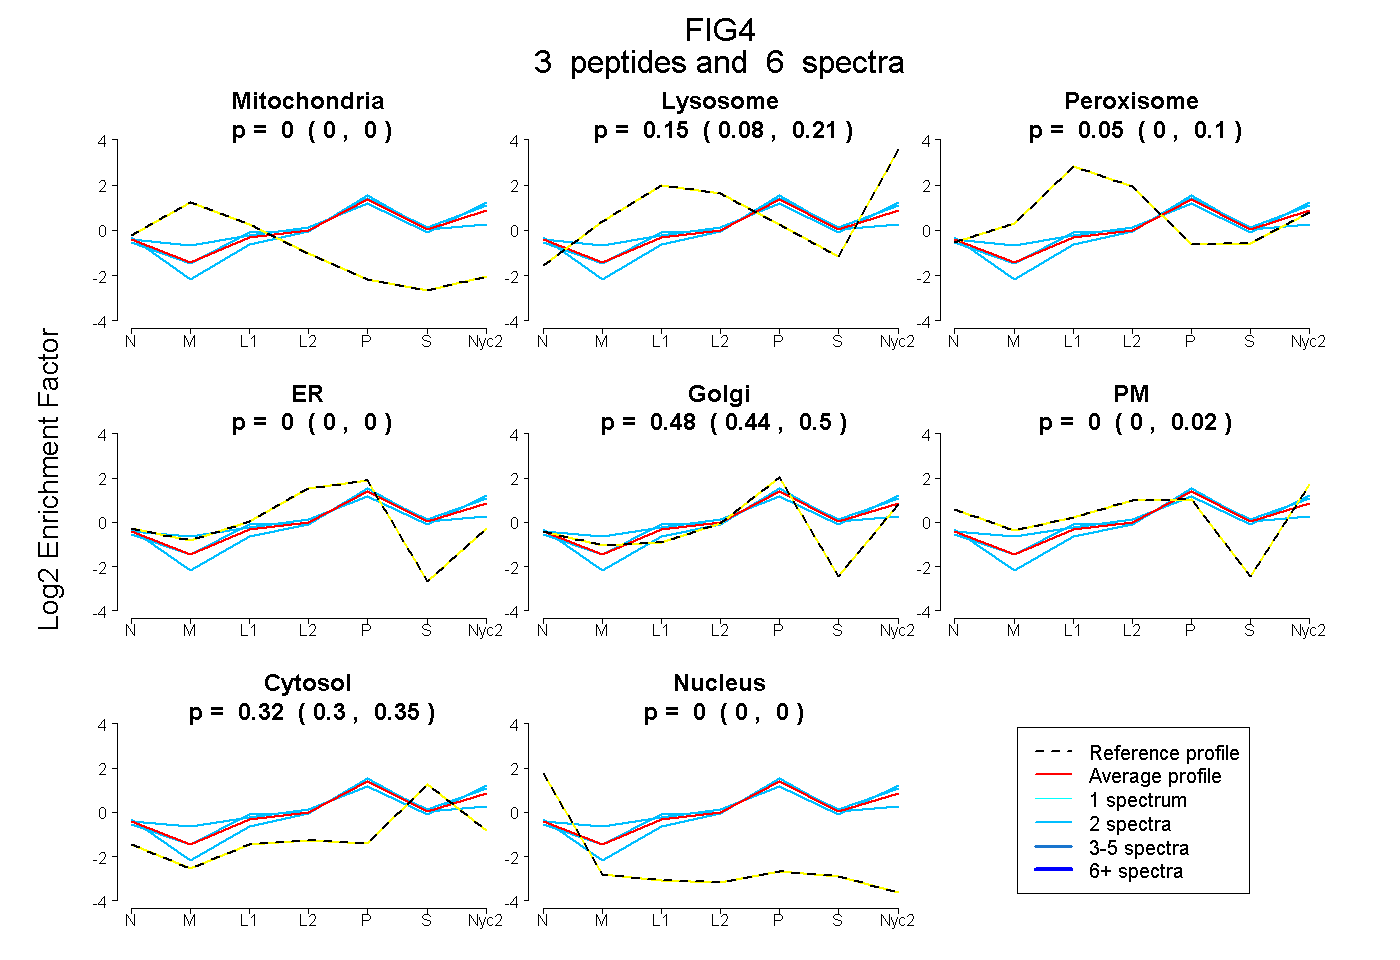 |
0.000
0.000 | 0.000 |
0.153
0.079 | 0.206 |
|
0.046
0.000 | 0.103 |
0.000
0.000 | 0.000 |
0.477
0.441 | 0.501 |
0.000
0.000 | 0.019 |
0.324
0.298 | 0.347 |
0.000
0.000 | 0.000 |
|
| | | Plot |
Mito |
|
Lyso or Perox |
|
ER |
Golgi |
PM |
Cytosol |
Nucleus |
|
| Expt B |
1
peptide |
2
spectra |
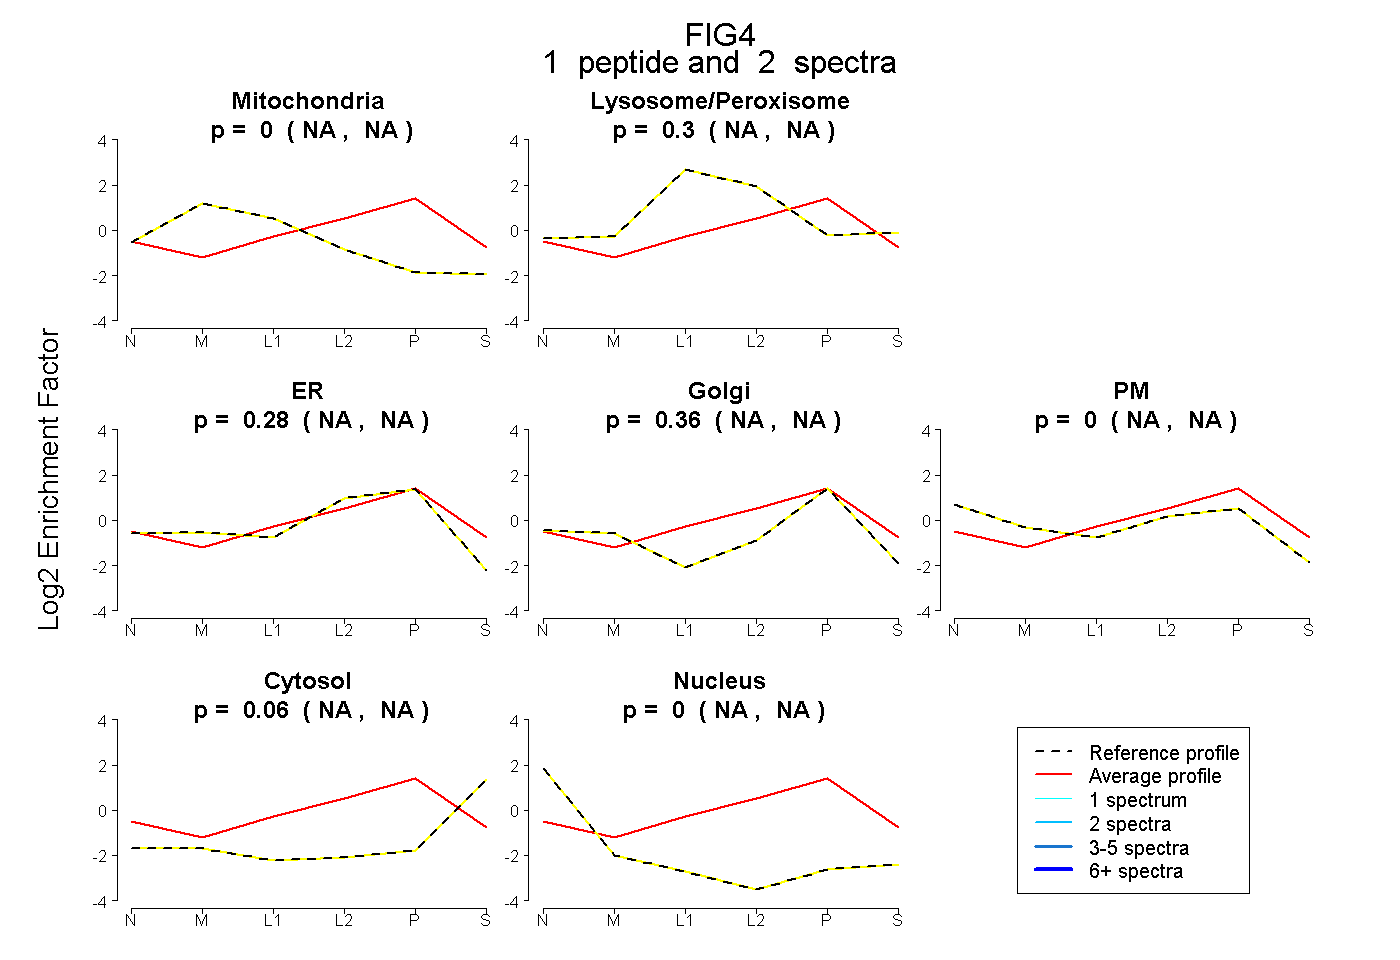 |
0.000
NA | NA |
|
0.299
NA | NA |
|
0.283
NA | NA |
0.357
NA | NA |
0.000
NA | NA |
0.062
NA | NA |
0.000
NA | NA |
|
| | | Plot |
|
Lyso |
|
|
|
|
|
|
|
Other |
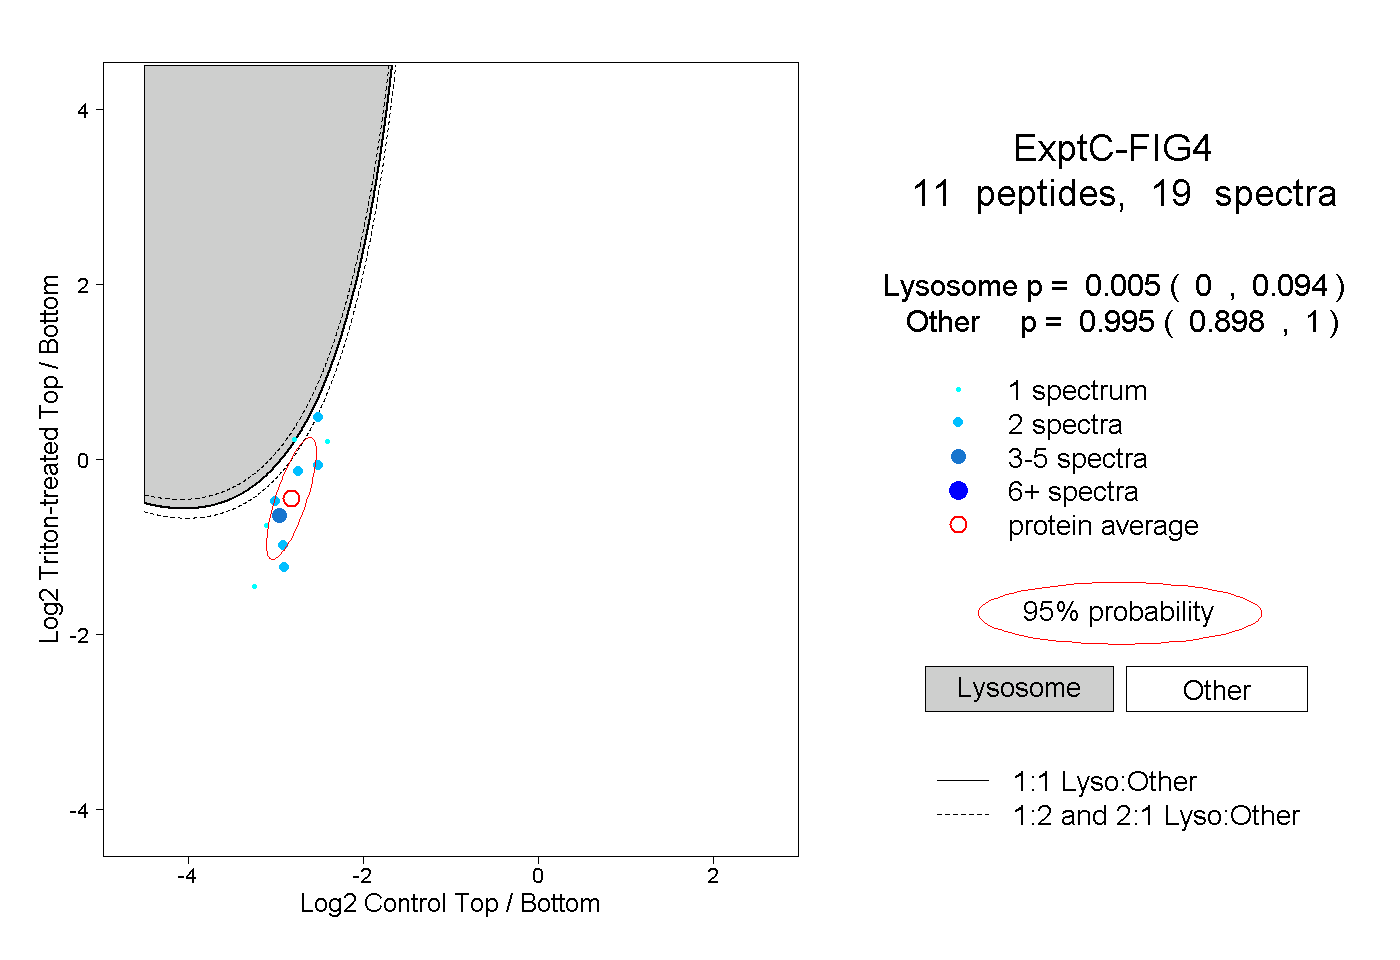
| Expt C |
11
peptides |
19
spectra |
 |
|
0.005
0.000 | 0.094 |
|
|
|
|
|
|
|
0.995
0.898 | 1.000 |
| 2 spectra, EDTAIYR |
|
0.029 |
|
|
|
|
|
|
|
0.971 |
| 2 spectra, DLVVIDDR |
|
0.148 |
|
|
|
|
|
|
|
0.852 |
| 1 spectrum, ITHPDEAR |
|
0.551 |
|
|
|
|
|
|
|
0.449 |
| 2 spectra, IAPWTQHSK |
|
0.000 |
|
|
|
|
|
|
|
1.000 |
| 2 spectra, LQTGILR |
|
0.022 |
|
|
|
|
|
|
|
0.978 |
| 2 spectra, TNCVDCLDR |
|
0.002 |
|
|
|
|
|
|
|
0.998 |
| 1 spectrum, LVLYETR |
|
0.000 |
|
|
|
|
|
|
|
1.000 |
| 3 spectra, KPDETGK |
|
0.003 |
|
|
|
|
|
|
|
0.997 |
| 2 spectra, VTESVAQPMK |
|
0.000 |
|
|
|
|
|
|
|
1.000 |
| 1 spectrum, MTDTGDSAK |
|
0.004 |
|
|
|
|
|
|
|
0.996 |
| 1 spectrum, SLSEEDHSIYAR |
|
0.004 |
|
|
|
|
|
|
|
0.996 |
| | | Plot |
|
Lyso |
|
|
|
|
|
|
|
Other |
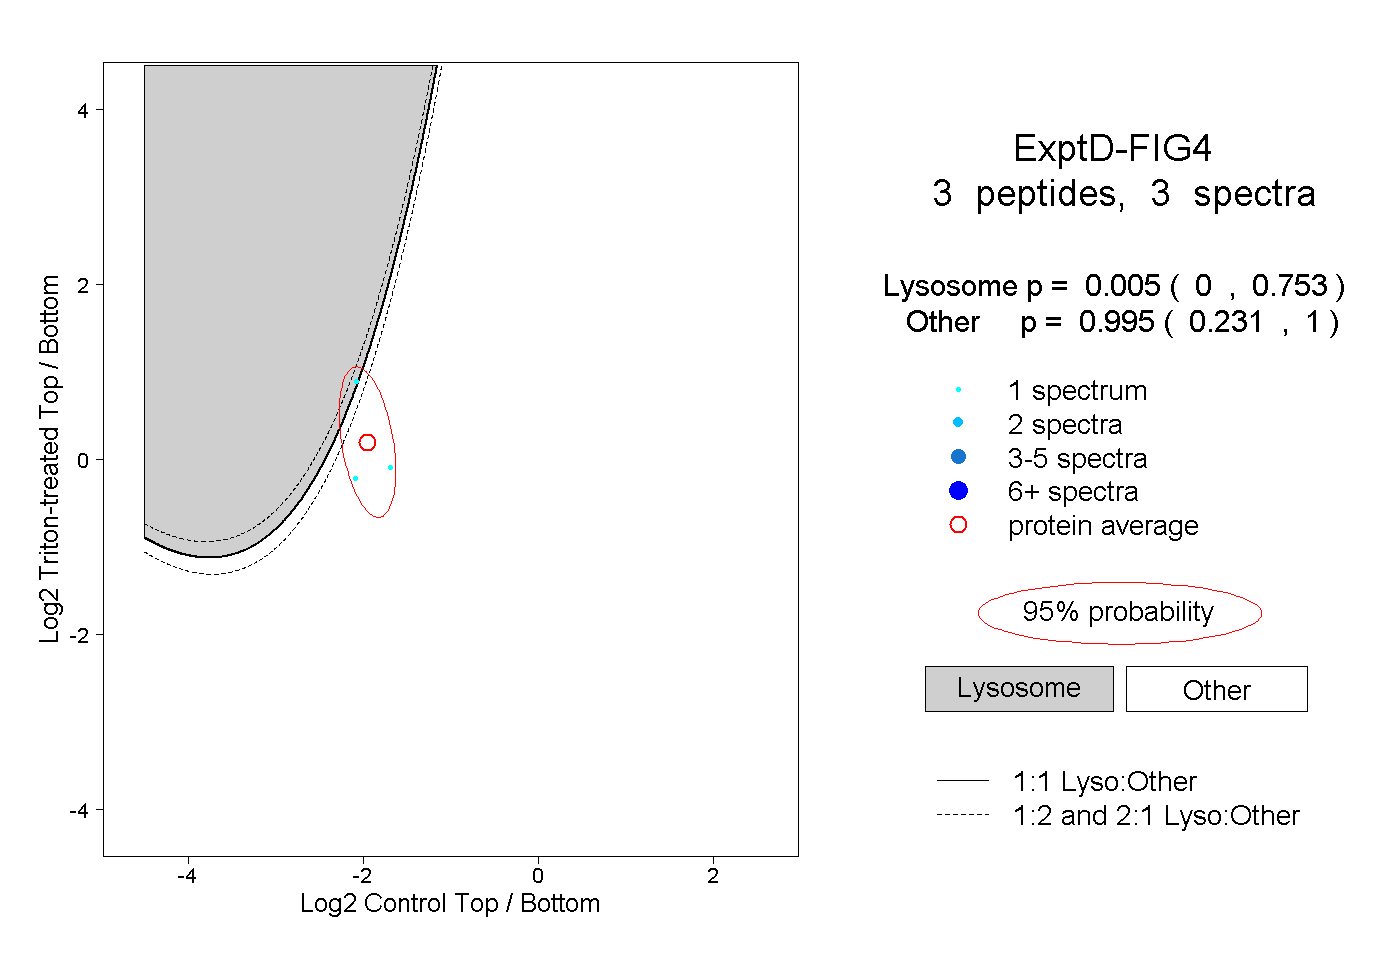
| Expt D |
3
peptides |
3
spectra |
 |
|
0.005
0.000 | 0.753 |
|
|
|
|
|
|
|
0.995
0.231 | 1.000 |