 9
9peptides
spectra
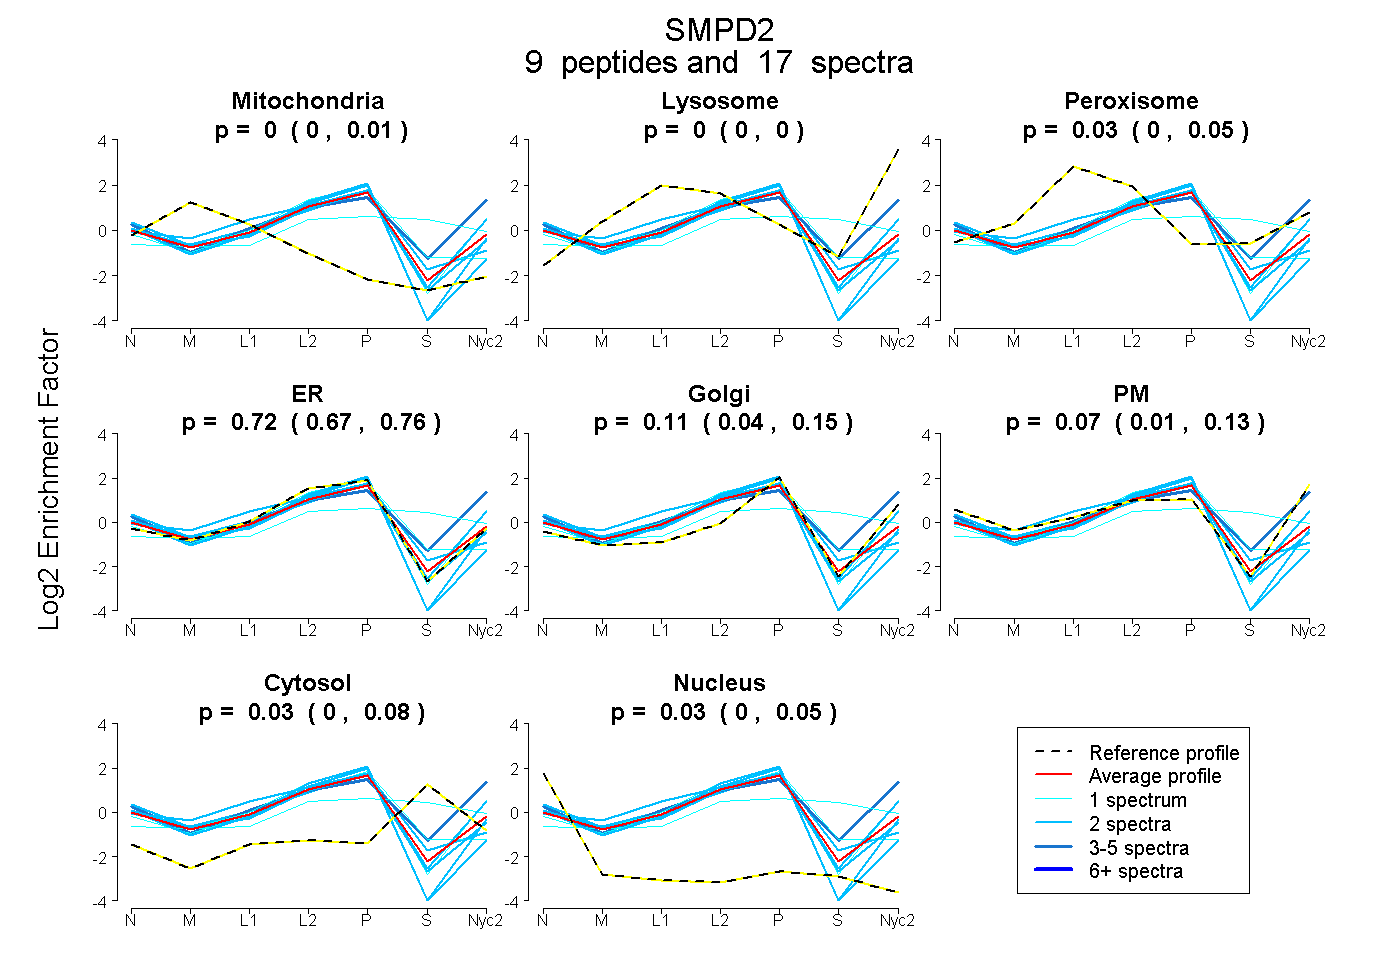
0.000 | 0.008
0.000 | 0.000
0.000 | 0.054
0.670 | 0.762
0.045 | 0.154
0.007 | 0.134
0.000 | 0.078
0.005 | 0.047
3peptides
spectra
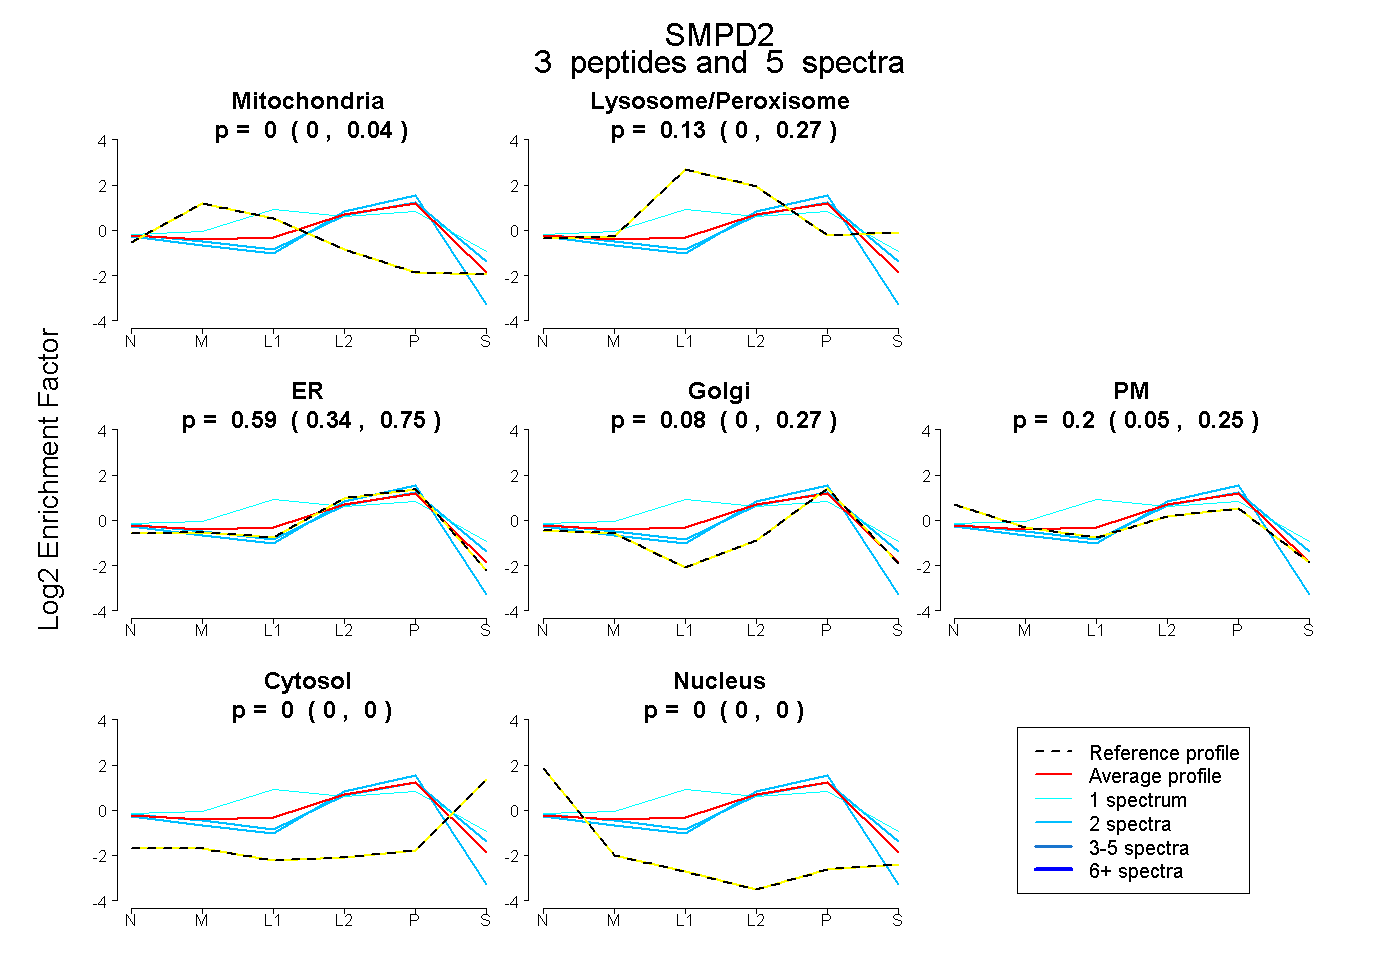
0.000 | 0.045
0.000 | 0.267
0.342 | 0.753
0.000 | 0.273
0.050 | 0.250
0.000 | 0.000
0.000 | 0.000
5peptides
spectra
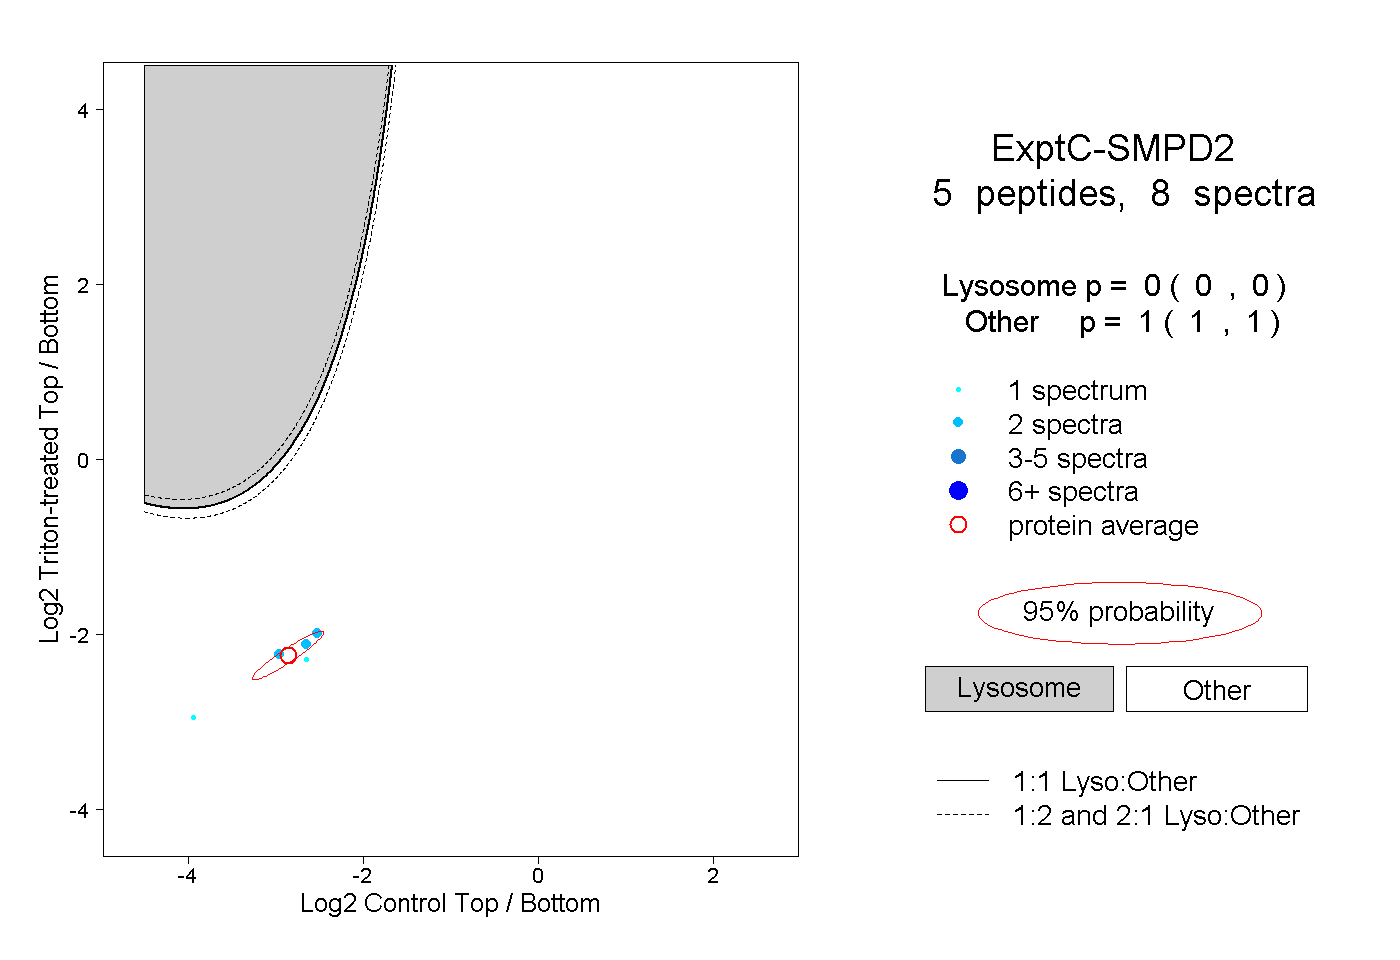
0.000 | 0.000
1.000 | 1.000