 9
9peptides
spectra
0.000 | 0.008
0.000 | 0.000
0.000 | 0.054
0.670 | 0.762
0.045 | 0.154
0.007 | 0.134
0.000 | 0.078
0.005 | 0.047
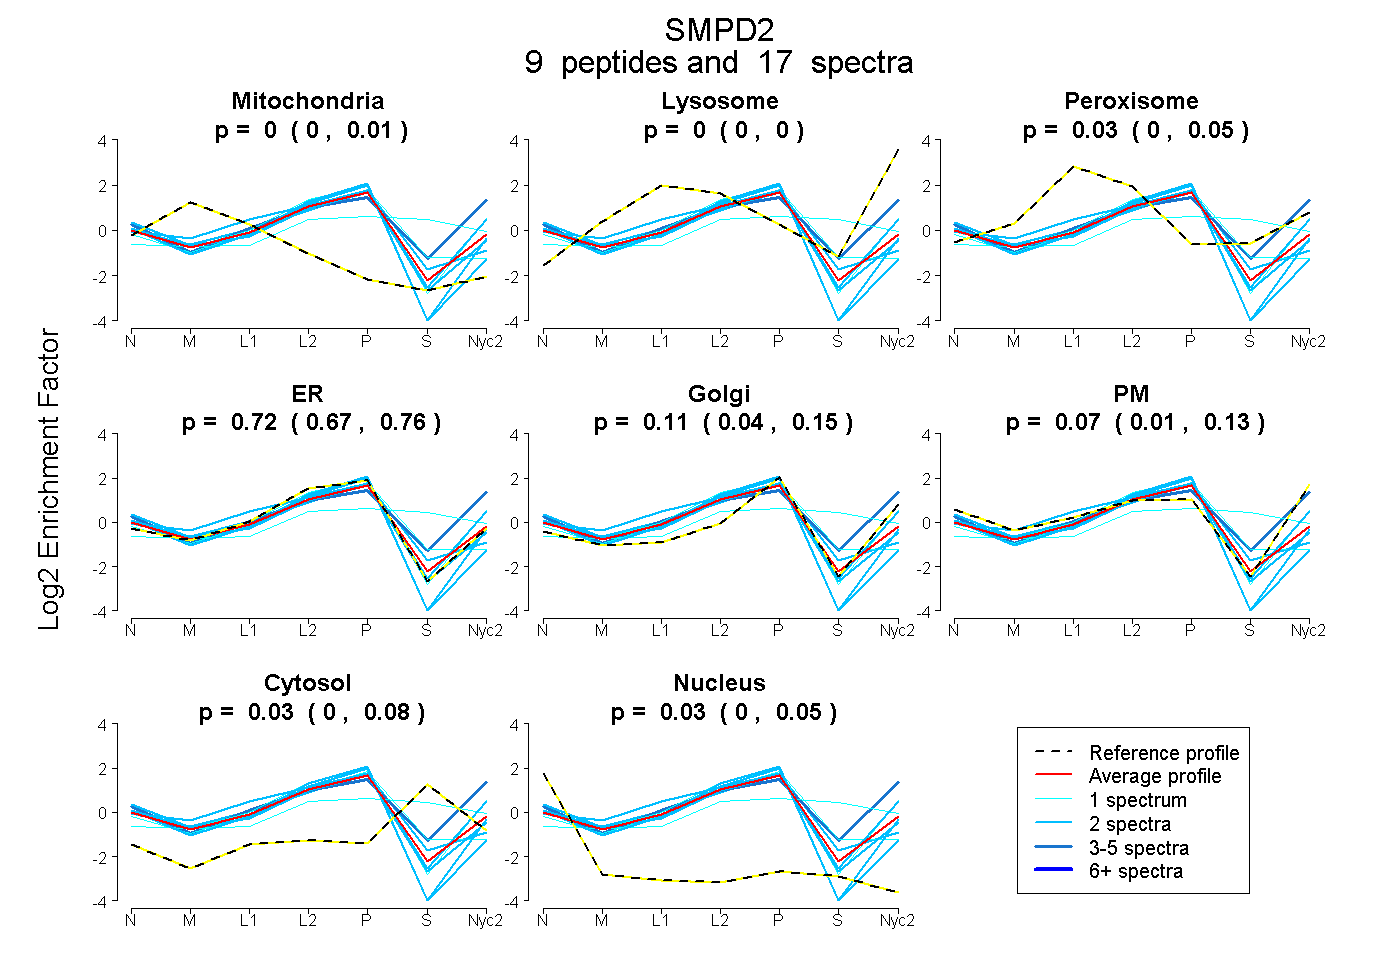
| Plot | Mito | Lyso | Perox | ER | Golgi | PM | Cytosol | Nucleus | |||||
| Expt A |
9 peptides |
17 spectra |
|
0.000 0.000 | 0.008 |
0.000 0.000 | 0.000 |
0.033 0.000 | 0.054 |
0.719 0.670 | 0.762 |
0.111 0.045 | 0.154 |
0.072 0.007 | 0.134 |
0.034 0.000 | 0.078 |
0.031 0.005 | 0.047 |
| 1 spectrum, DLGCCLLK | 0.000 | 0.000 | 0.000 | 0.794 | 0.000 | 0.000 | 0.206 | 0.000 | ||
| 2 spectra, SALISALR | 0.000 | 0.000 | 0.000 | 0.951 | 0.008 | 0.000 | 0.000 | 0.040 | ||
| 2 spectra, HNFSLR | 0.000 | 0.000 | 0.000 | 0.789 | 0.002 | 0.121 | 0.000 | 0.087 | ||
| 1 spectrum, EWTGLR | 0.000 | 0.074 | 0.123 | 0.263 | 0.091 | 0.000 | 0.450 | 0.000 | ||
| 2 spectra, ANVVLLCGDLNMHPK | 0.056 | 0.000 | 0.000 | 0.827 | 0.000 | 0.000 | 0.115 | 0.001 | ||
| 2 spectra, SGIIGSGLCVFSR | 0.000 | 0.000 | 0.000 | 0.909 | 0.000 | 0.000 | 0.000 | 0.091 | ||
| 4 spectra, AQAEIQHVLTR | 0.000 | 0.082 | 0.000 | 0.148 | 0.086 | 0.562 | 0.122 | 0.000 | ||
| 1 spectrum, DAFVETEDFK | 0.000 | 0.000 | 0.000 | 0.632 | 0.109 | 0.260 | 0.000 | 0.000 | ||
| 2 spectra, IDYVLYK | 0.002 | 0.023 | 0.057 | 0.570 | 0.060 | 0.287 | 0.000 | 0.000 |
| Plot | Mito | Lyso or Perox | ER | Golgi | PM | Cytosol | Nucleus | ||||||
| Expt B |
3 peptides |
5 spectra |
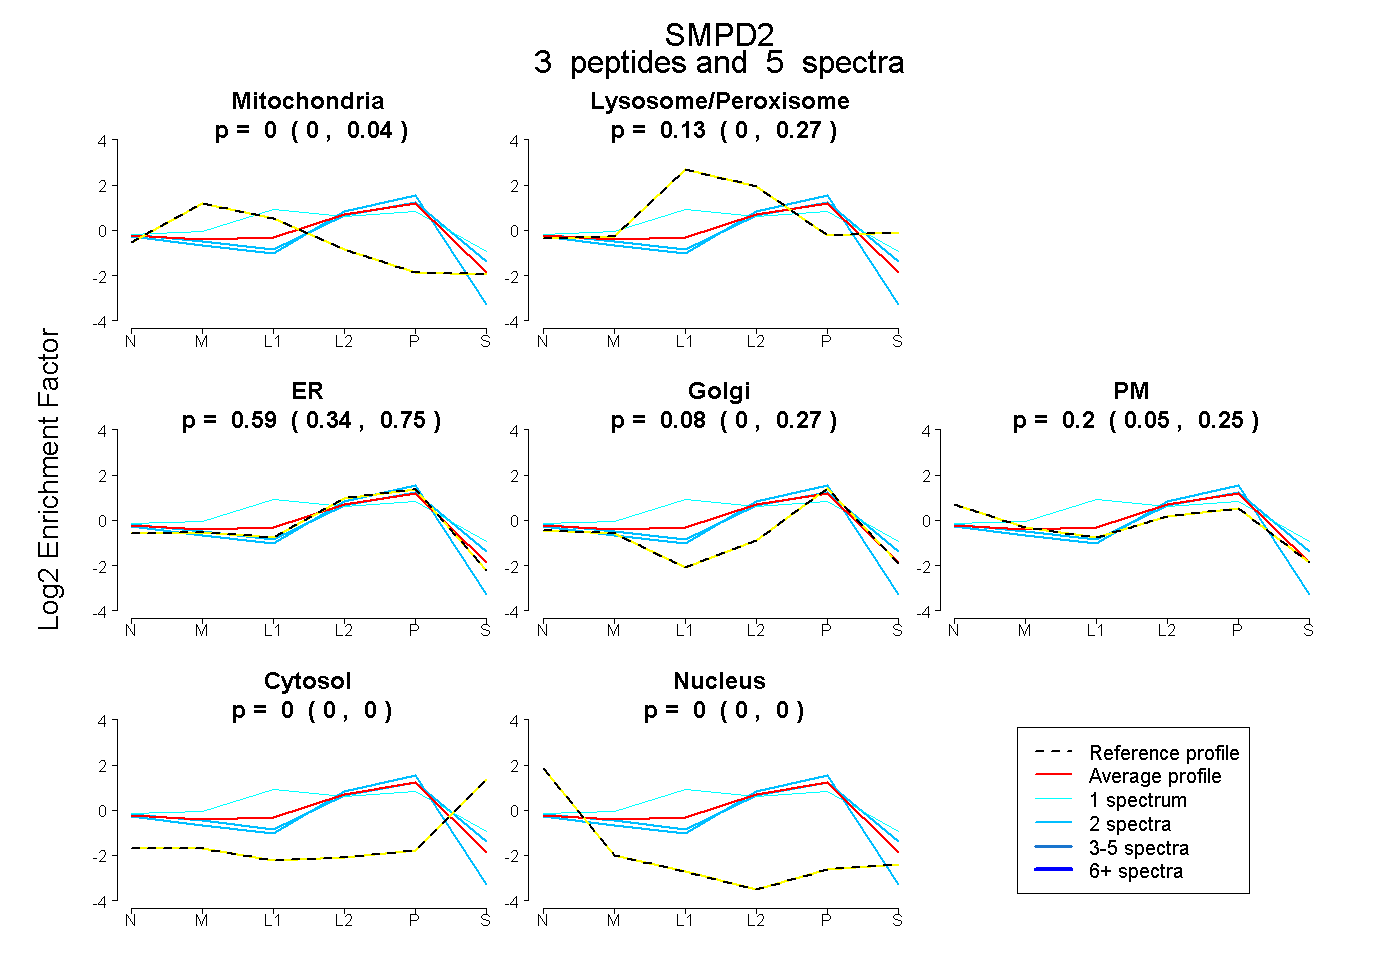 |
0.000 0.000 | 0.045 |
0.125 0.000 | 0.267 |
0.592 0.342 | 0.753 |
0.083 0.000 | 0.273 |
0.200 0.050 | 0.250 |
0.000 0.000 | 0.000 |
0.000 0.000 | 0.000 |
|||
| Plot | Lyso | Other | |||||||||||
| Expt C |
5 peptides |
8 spectra |
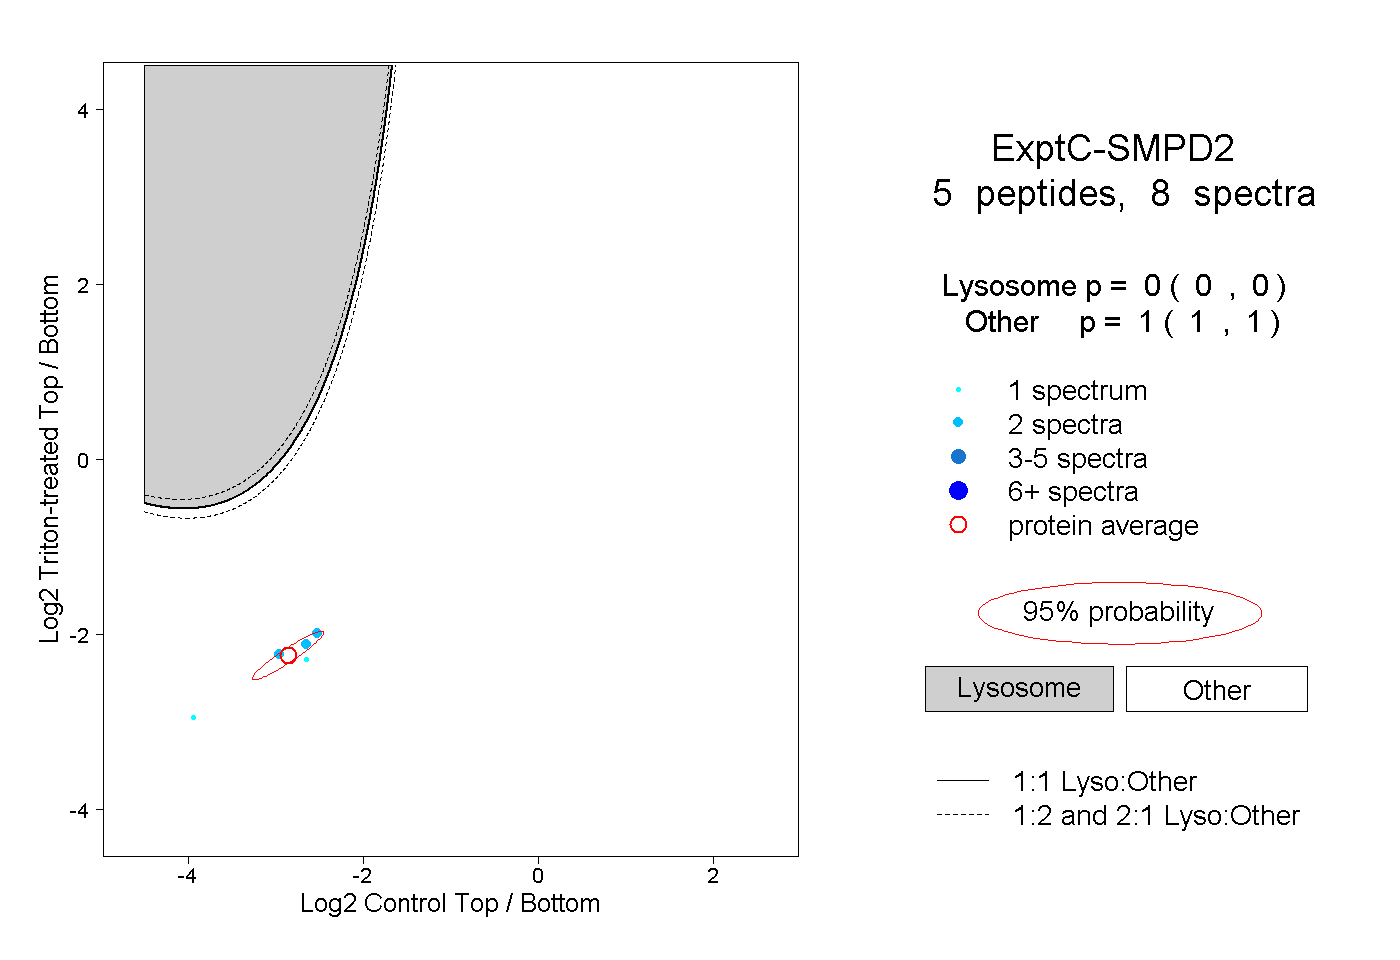 |
0.000 0.000 | 0.000 |
1.000 1.000 | 1.000 |