 5
5peptides
spectra
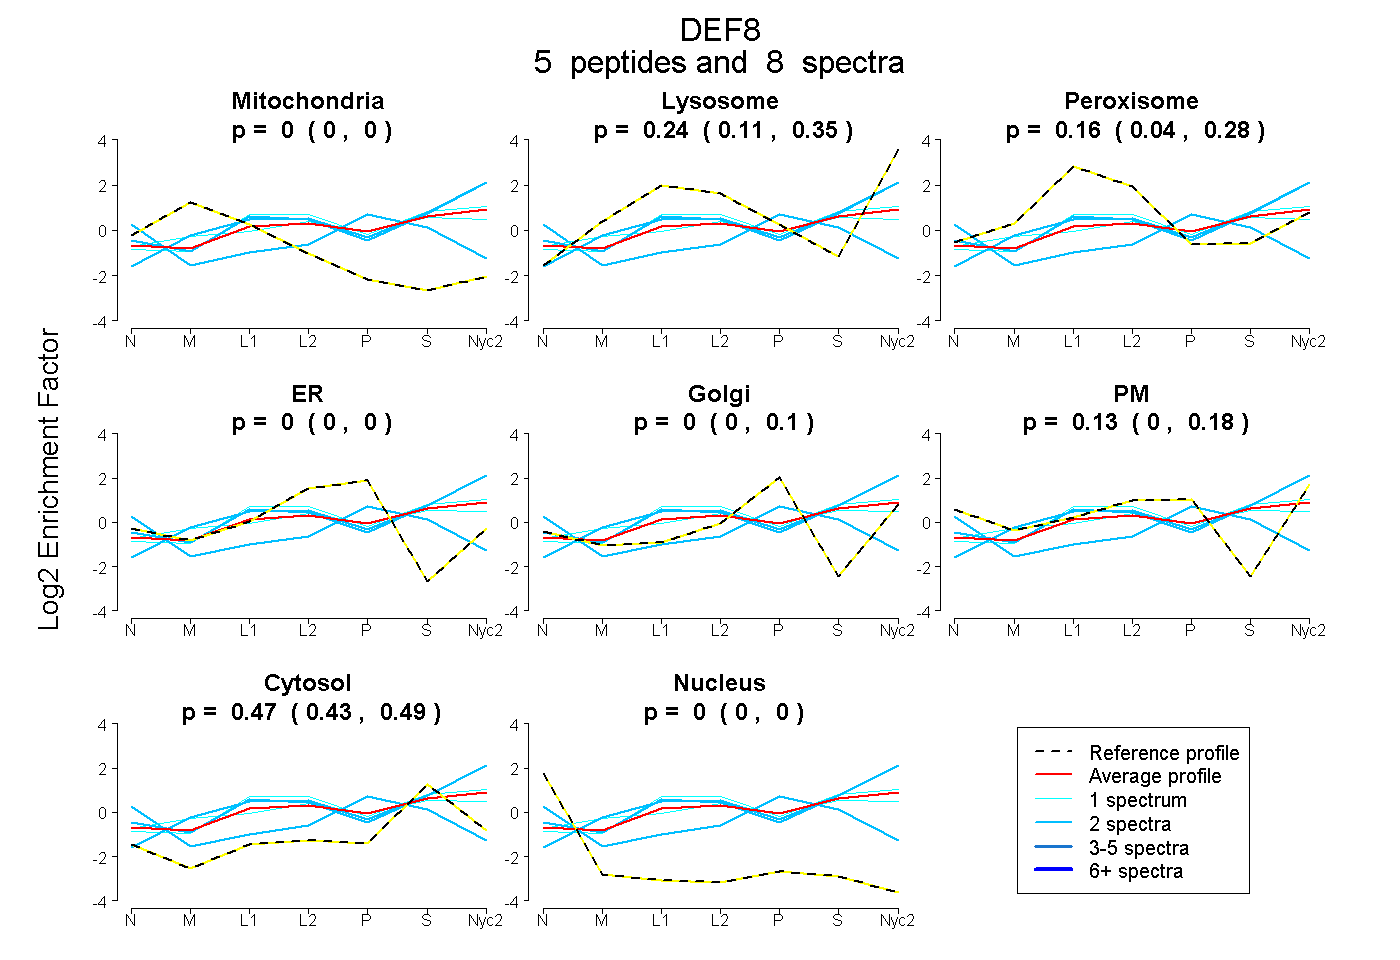
0.000 | 0.000
0.114 | 0.348
0.045 | 0.278
0.000 | 0.000
0.000 | 0.096
0.000 | 0.175
0.428 | 0.488
0.000 | 0.000
5peptides
spectra
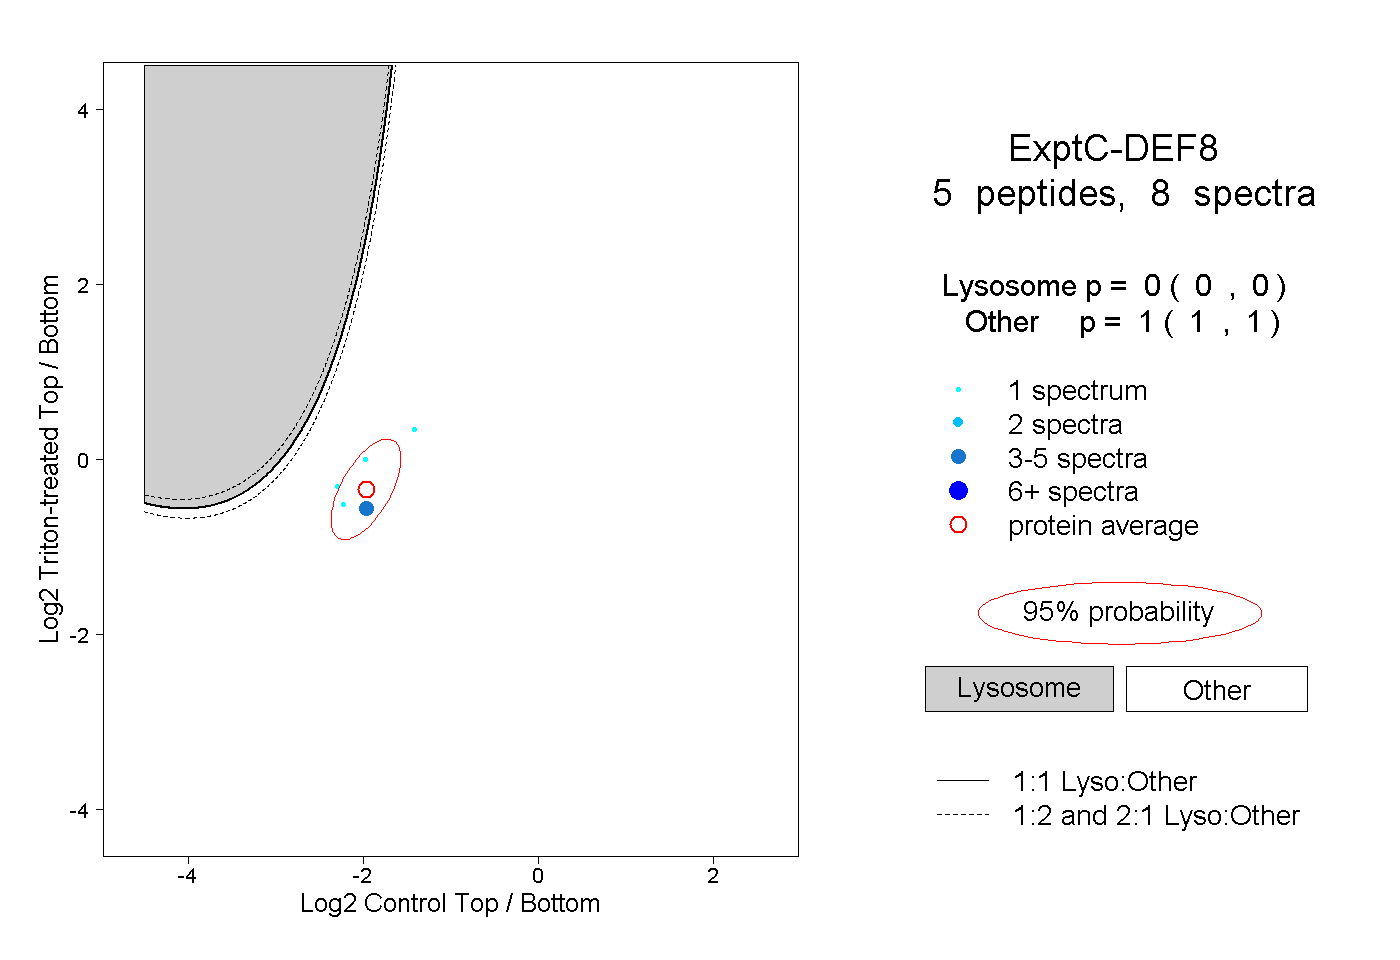
0.000 | 0.000
1.000 | 1.000
2peptides
spectra
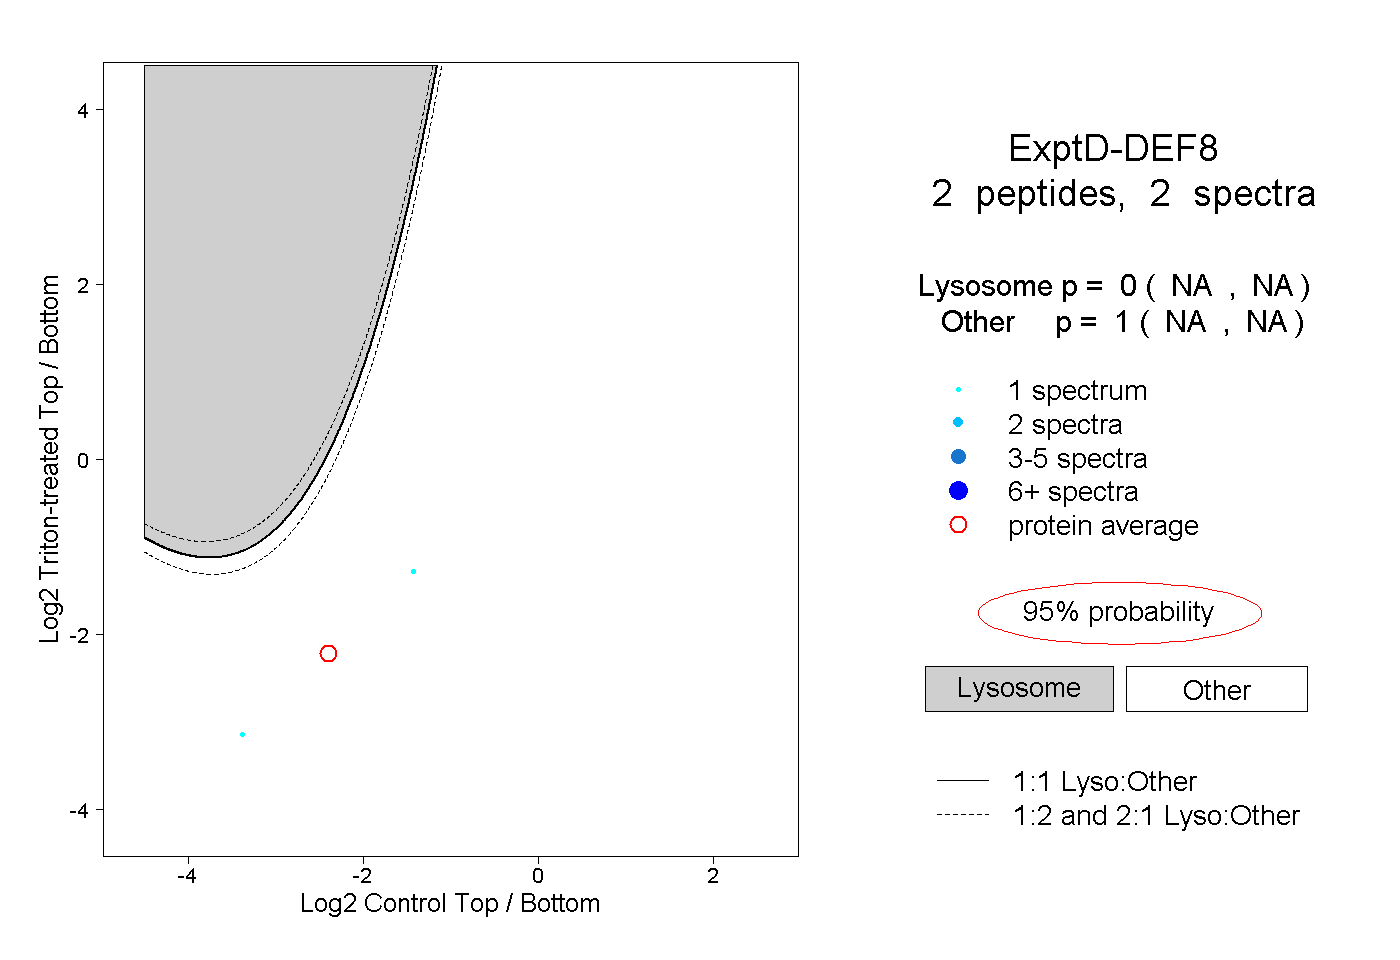
NA | NA
NA | NA