 5
5peptides
spectra
0.000 | 0.000
0.114 | 0.348
0.045 | 0.278
0.000 | 0.000
0.000 | 0.096
0.000 | 0.175
0.428 | 0.488
0.000 | 0.000
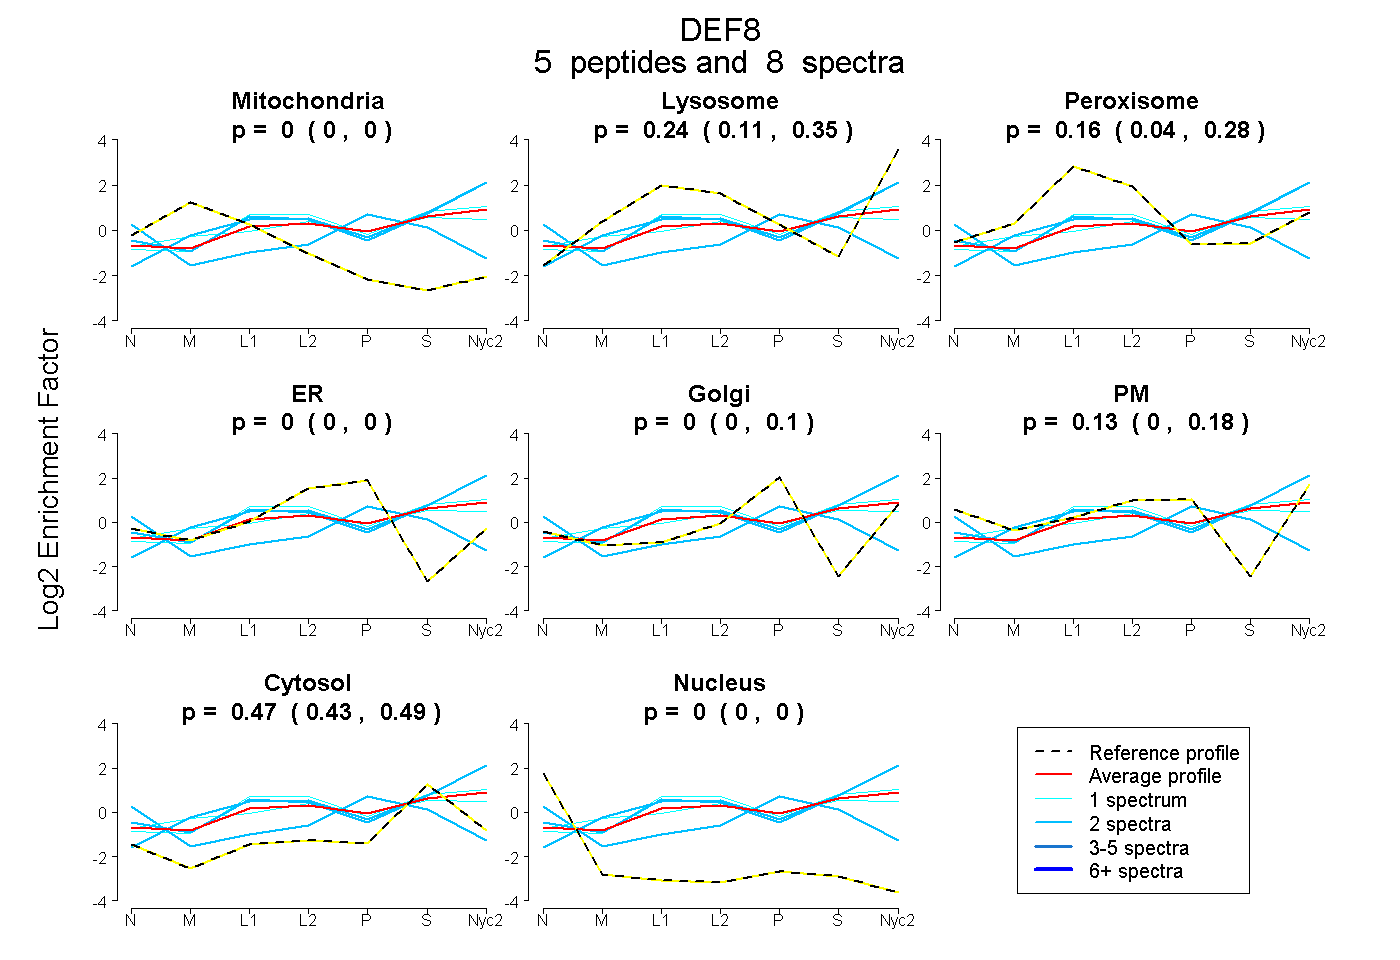
| Plot | Mito | Lyso | Perox | ER | Golgi | PM | Cytosol | Nucleus | |||||
| Expt A |
5 peptides |
8 spectra |
|
0.000 0.000 | 0.000 |
0.240 0.114 | 0.348 |
0.157 0.045 | 0.278 |
0.000 0.000 | 0.000 |
0.000 0.000 | 0.096 |
0.135 0.000 | 0.175 |
0.467 0.428 | 0.488 |
0.000 0.000 | 0.000 |
| 1 spectrum, CLNLISRPCVSSK | 0.000 | 0.292 | 0.280 | 0.000 | 0.000 | 0.000 | 0.428 | 0.000 | ||
| 2 spectra, VLLEHR | 0.000 | 0.612 | 0.000 | 0.000 | 0.000 | 0.000 | 0.388 | 0.000 | ||
| 2 spectra, EYDEK | 0.000 | 0.000 | 0.000 | 0.361 | 0.055 | 0.000 | 0.495 | 0.088 | ||
| 1 spectrum, GFVCELCK | 0.000 | 0.135 | 0.282 | 0.000 | 0.099 | 0.059 | 0.425 | 0.000 | ||
| 2 spectra, VVHNWDFEPR | 0.000 | 0.531 | 0.052 | 0.000 | 0.000 | 0.000 | 0.416 | 0.000 |
| Plot | Lyso | Other | |||||||||||
| Expt C |
5 peptides |
8 spectra |
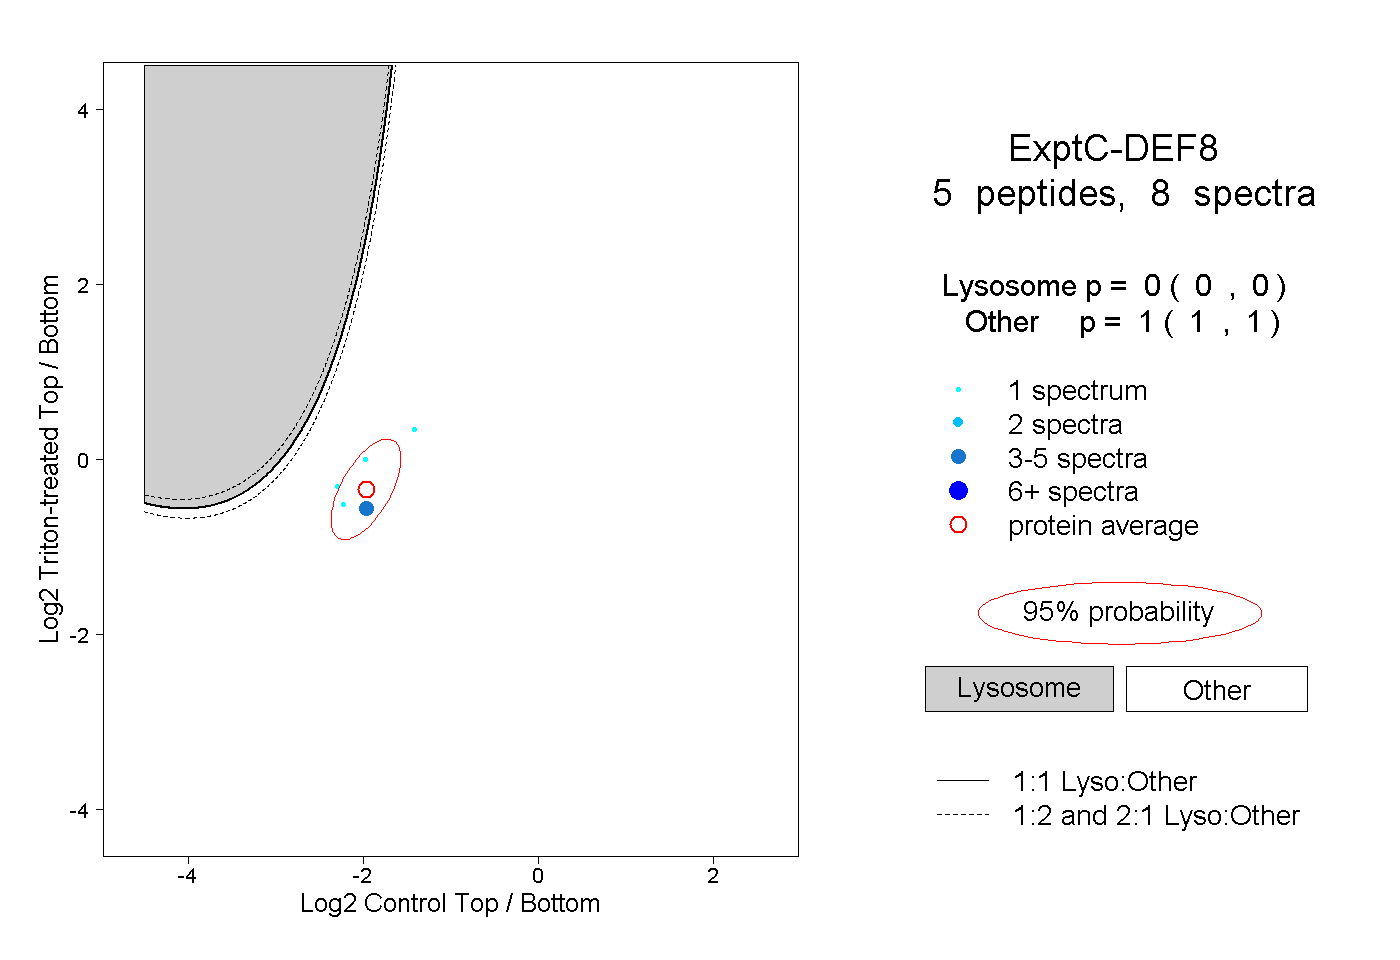 |
0.000 0.000 | 0.000 |
1.000 1.000 | 1.000 |
||||||||
| Plot | Lyso | Other | |||||||||||
| Expt D |
2 peptides |
2 spectra |
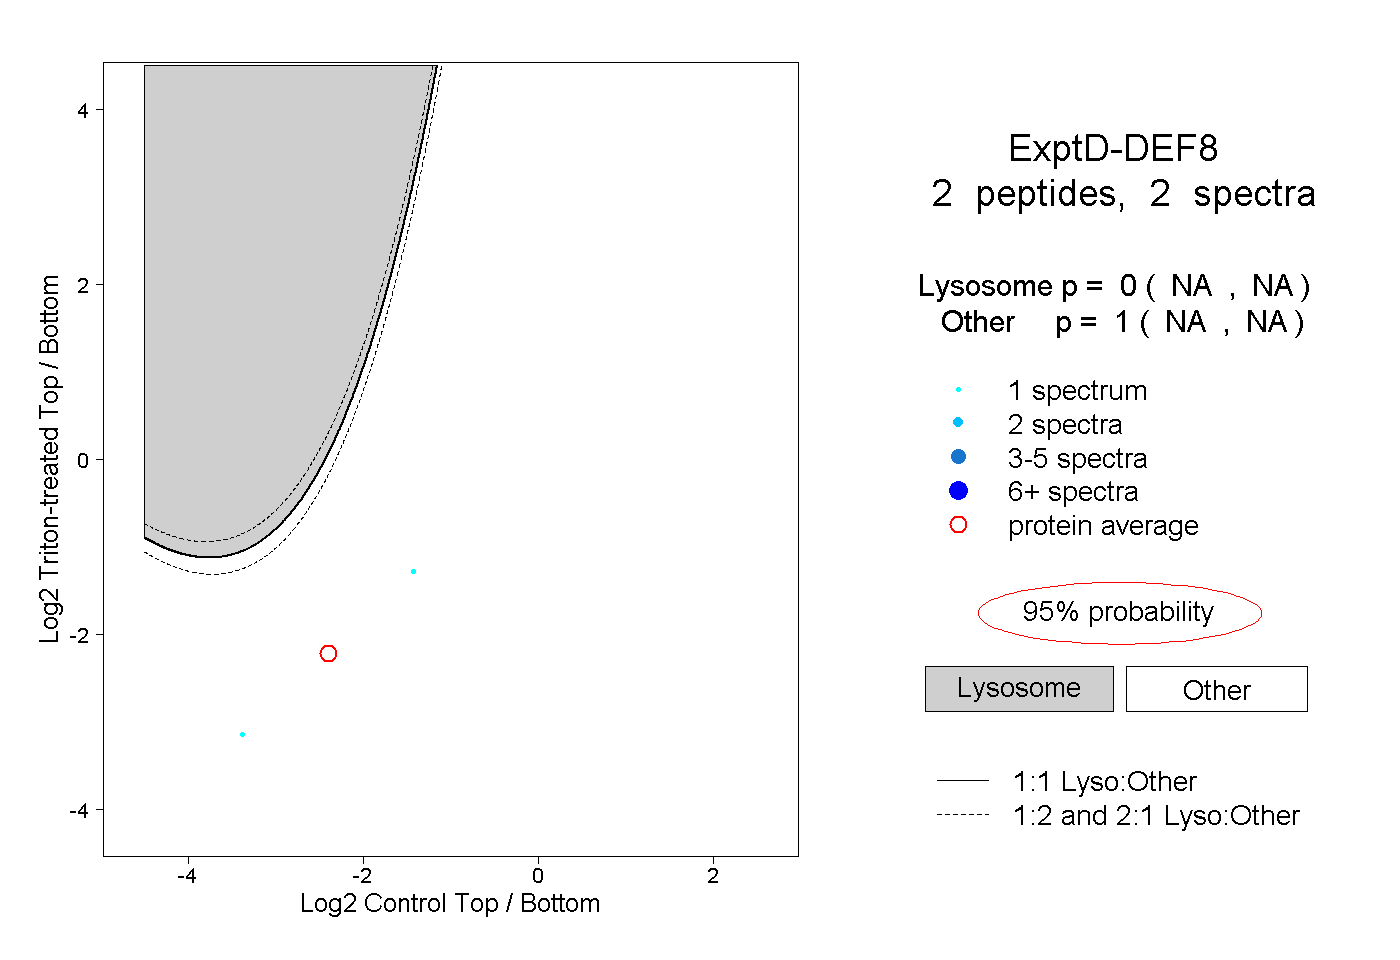 |
0.000 NA | NA |
1.000 NA | NA |