 7
7peptides
spectra
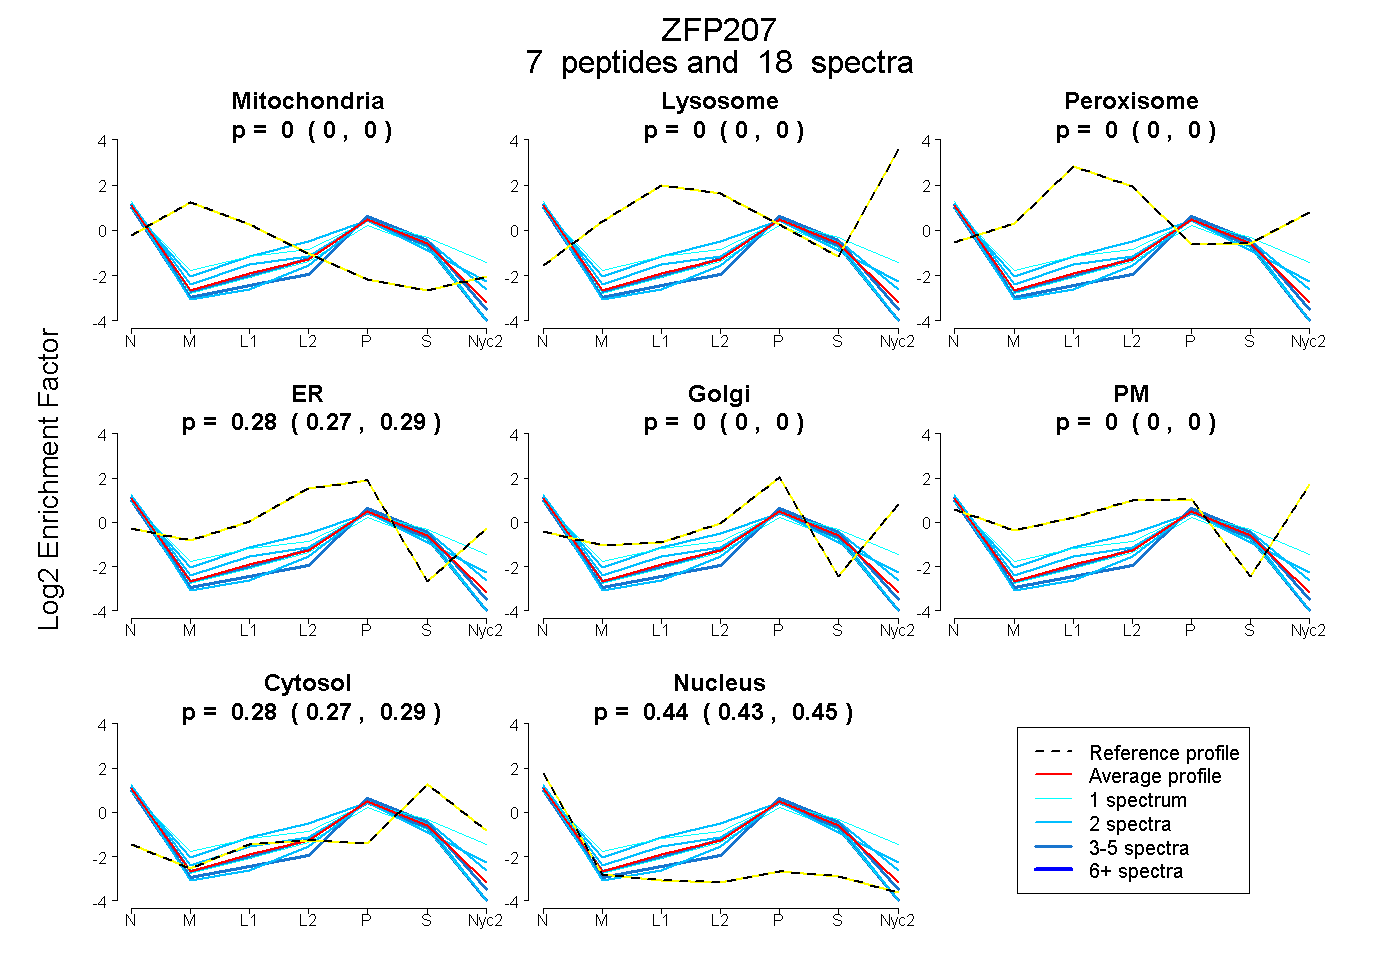
0.000 | 0.000
0.000 | 0.000
0.000 | 0.000
0.270 | 0.289
0.000 | 0.000
0.000 | 0.000
0.267 | 0.286
0.428 | 0.453
4peptides
spectra
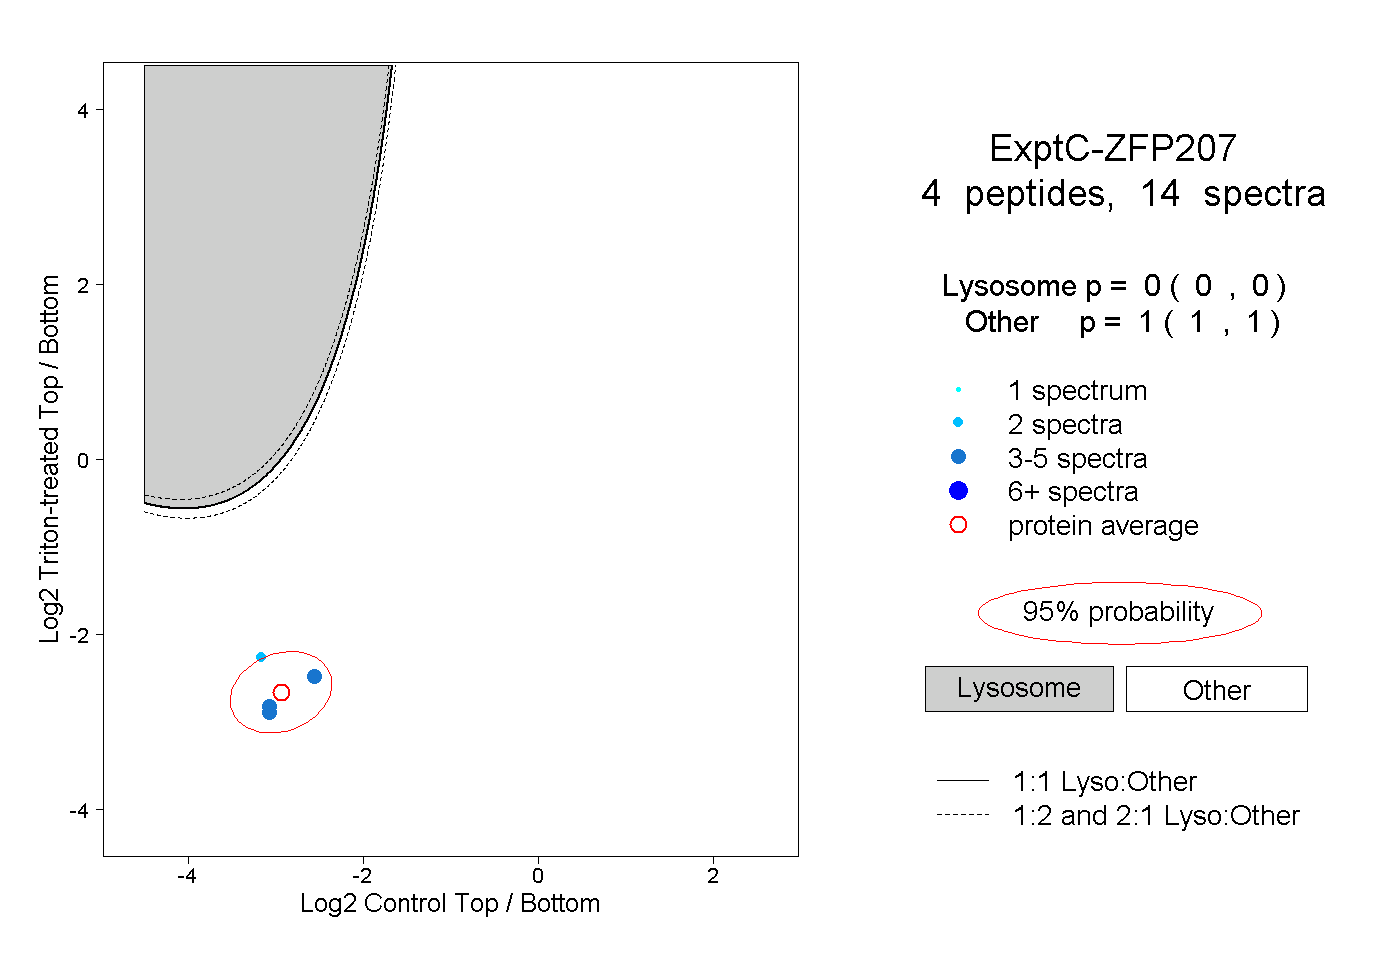
0.000 | 0.000
1.000 | 1.000
1peptide
spectrum
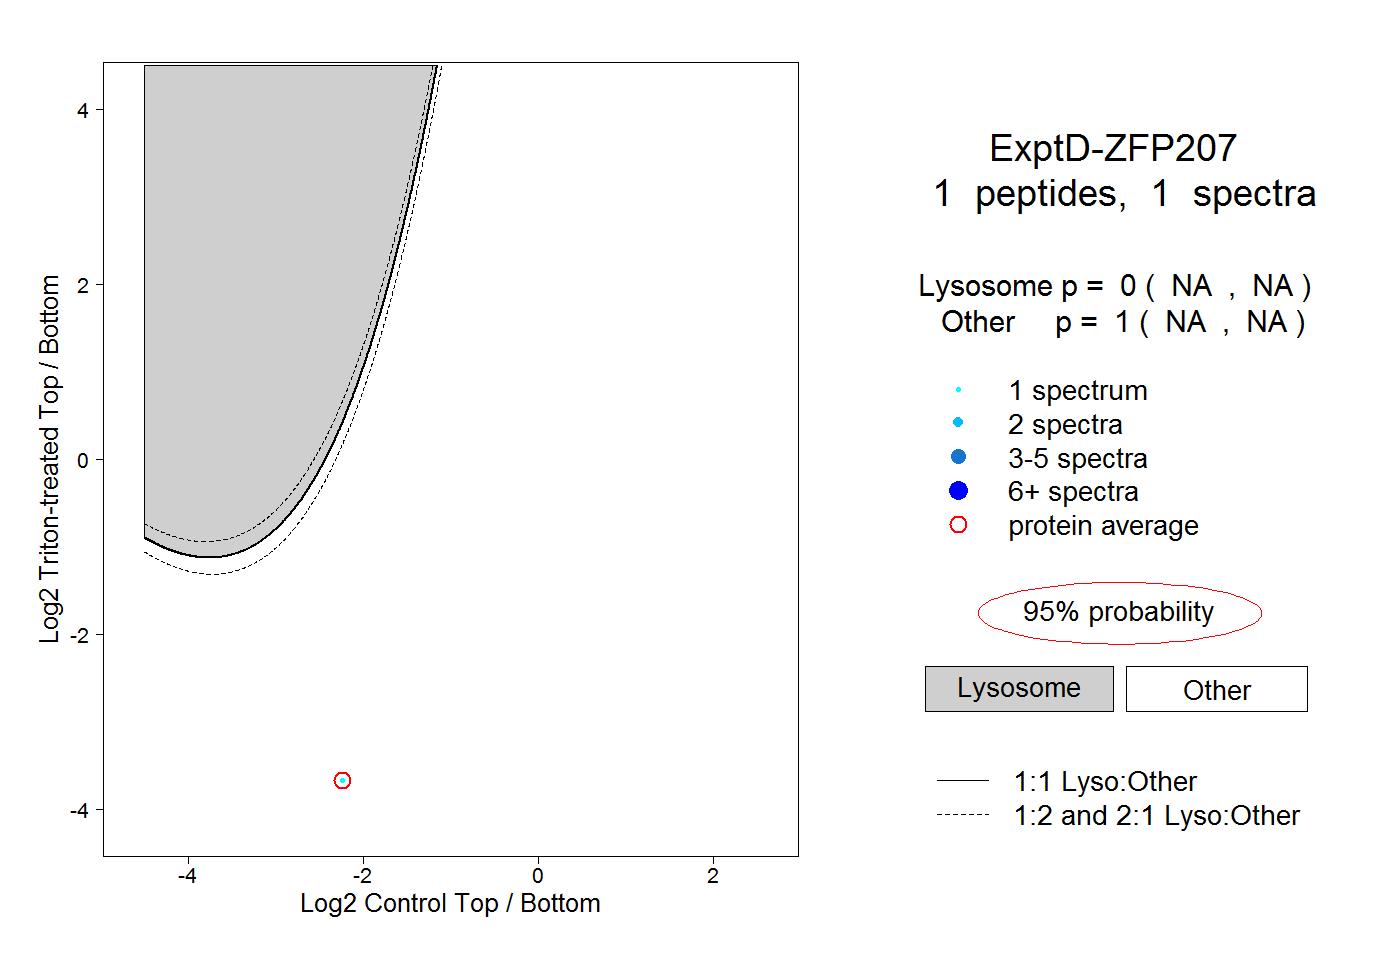
NA | NA
NA | NA