 7
7peptides
spectra
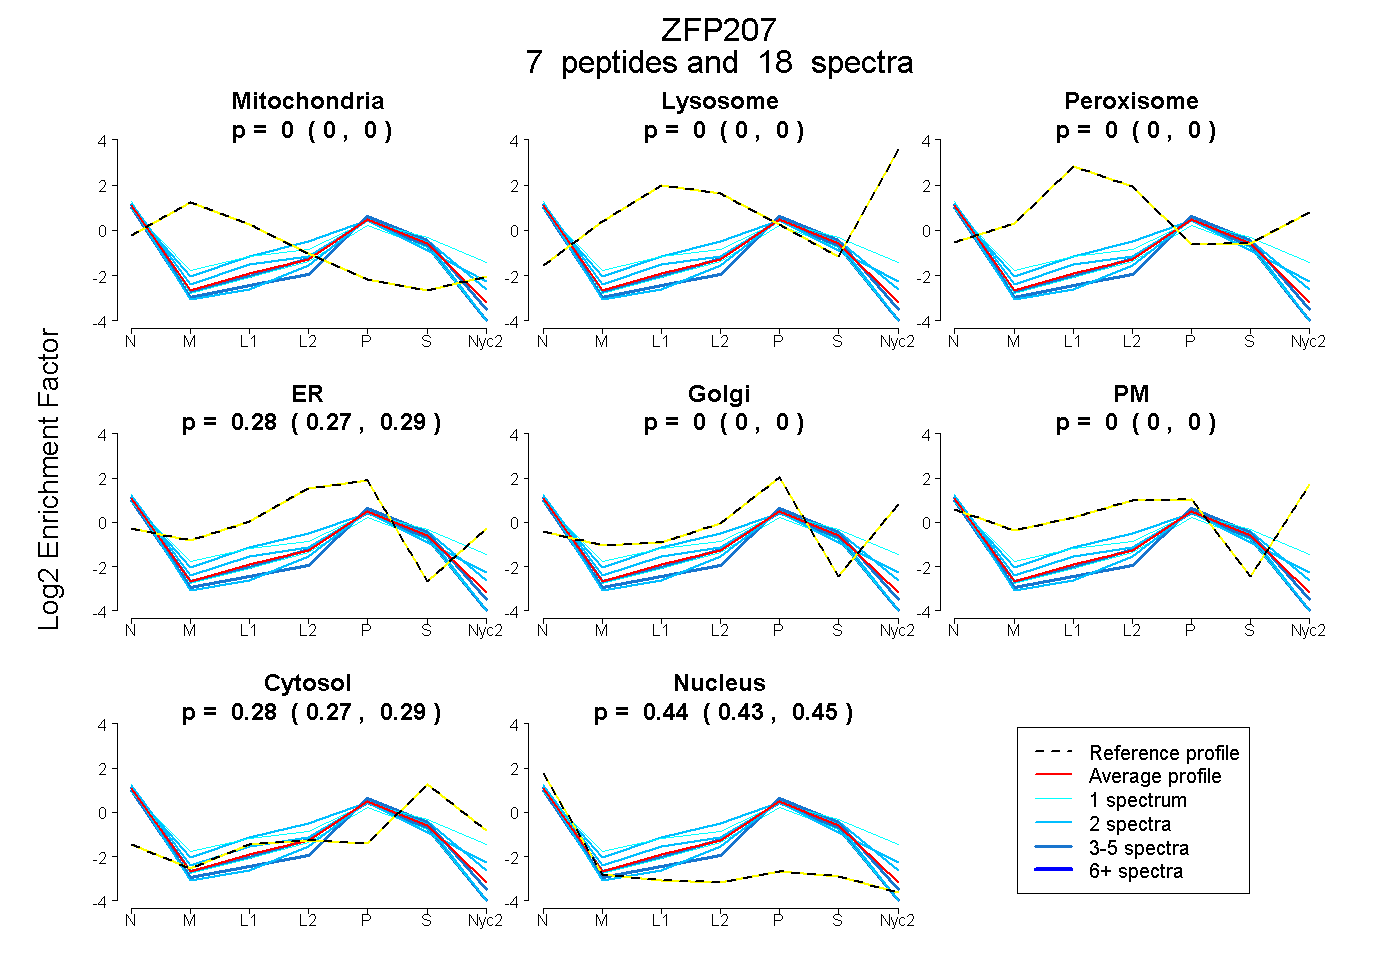
0.000 | 0.000
0.000 | 0.000
0.000 | 0.000
0.270 | 0.289
0.000 | 0.000
0.000 | 0.000
0.267 | 0.286
0.428 | 0.453
| Plot | Mito | Lyso | Perox | ER | Golgi | PM | Cytosol | Nucleus | |||||
| Expt A |
7 peptides |
18 spectra |
|
0.000 0.000 | 0.000 |
0.000 0.000 | 0.000 |
0.000 0.000 | 0.000 |
0.280 0.270 | 0.289 |
0.000 0.000 | 0.000 |
0.000 0.000 | 0.000 |
0.278 0.267 | 0.286 |
0.442 0.428 | 0.453 |
| 1 spectrum, ETIDAVPNAIPGR | 0.000 | 0.000 | 0.000 | 0.234 | 0.000 | 0.000 | 0.215 | 0.551 | ||
| 5 spectra, DFDDEK | 0.000 | 0.000 | 0.000 | 0.266 | 0.000 | 0.000 | 0.217 | 0.517 | ||
| 2 spectra, QLKPWCWYCNR | 0.000 | 0.000 | 0.000 | 0.188 | 0.000 | 0.000 | 0.266 | 0.547 | ||
| 1 spectrum, LYTGPGLAIHCMQVHK | 0.000 | 0.000 | 0.000 | 0.305 | 0.050 | 0.046 | 0.372 | 0.225 | ||
| 5 spectra, LIHPDEDISLEER | 0.000 | 0.000 | 0.000 | 0.185 | 0.000 | 0.000 | 0.311 | 0.504 | ||
| 2 spectra, CHICHK | 0.000 | 0.000 | 0.000 | 0.391 | 0.000 | 0.000 | 0.307 | 0.302 | ||
| 2 spectra, TQESQK | 0.000 | 0.000 | 0.000 | 0.364 | 0.000 | 0.000 | 0.248 | 0.388 |
| Plot | Lyso | Other | |||||||||||
| Expt C |
4 peptides |
14 spectra |
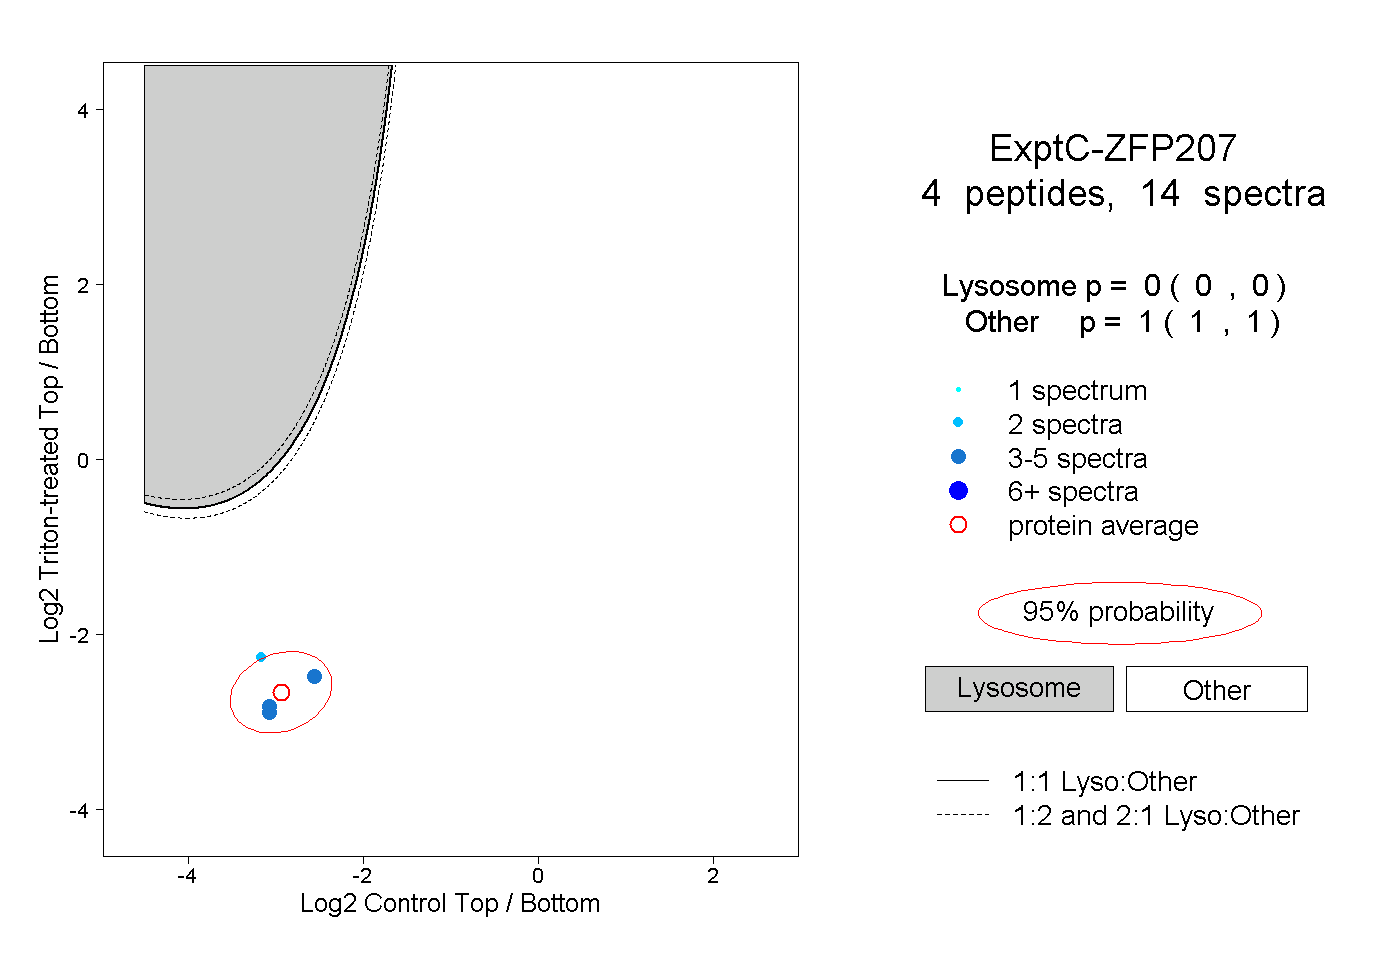 |
0.000 0.000 | 0.000 |
1.000 1.000 | 1.000 |
||||||||
| Plot | Lyso | Other | |||||||||||
| Expt D |
1 peptide |
1 spectrum |
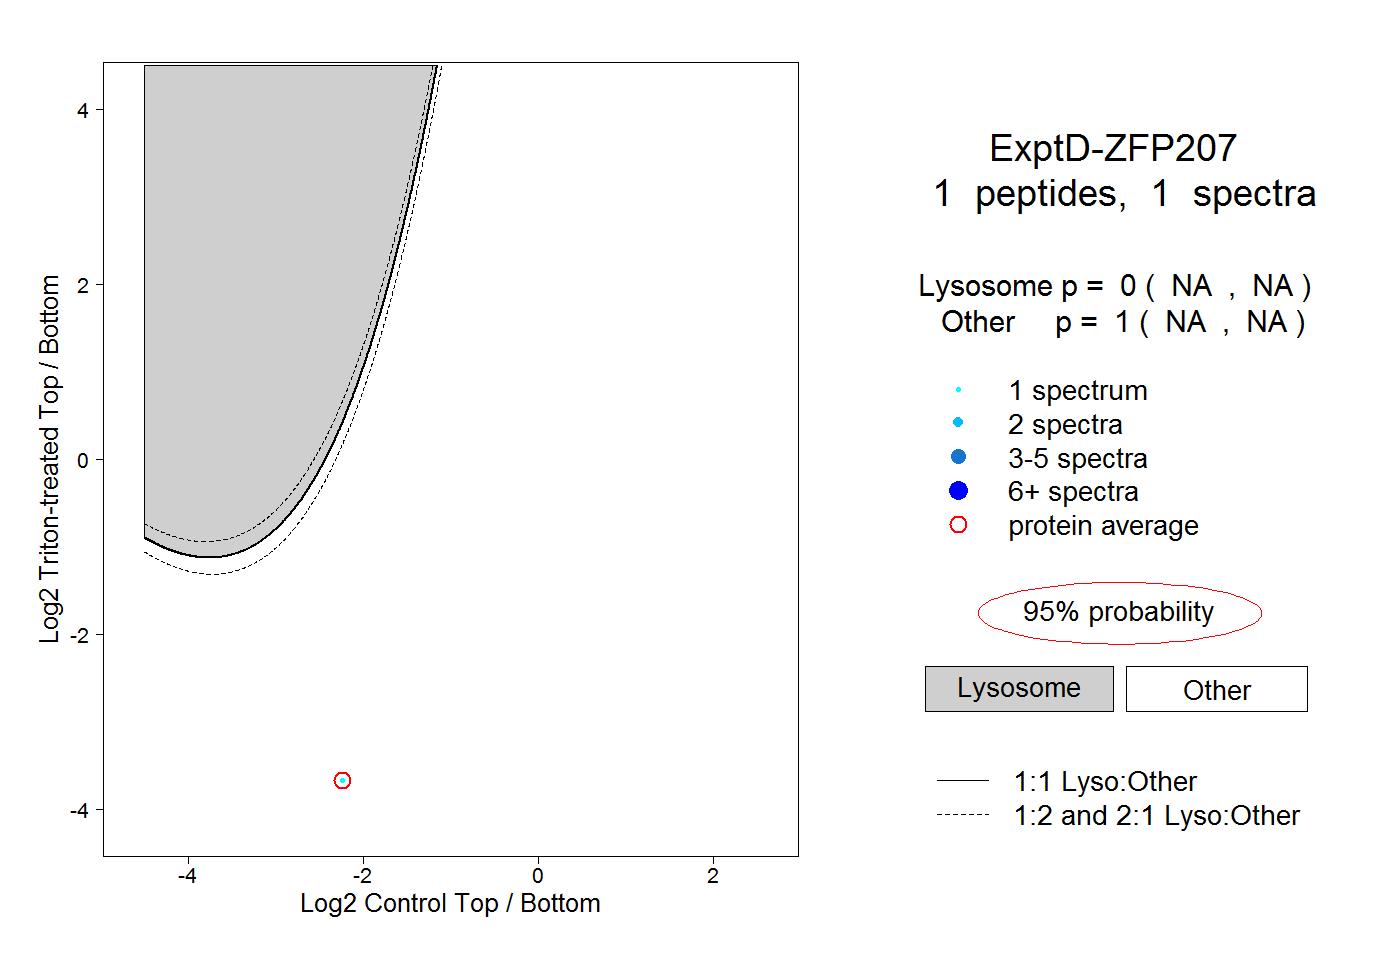 |
0.000 NA | NA |
1.000 NA | NA |