 13
13peptides
spectra
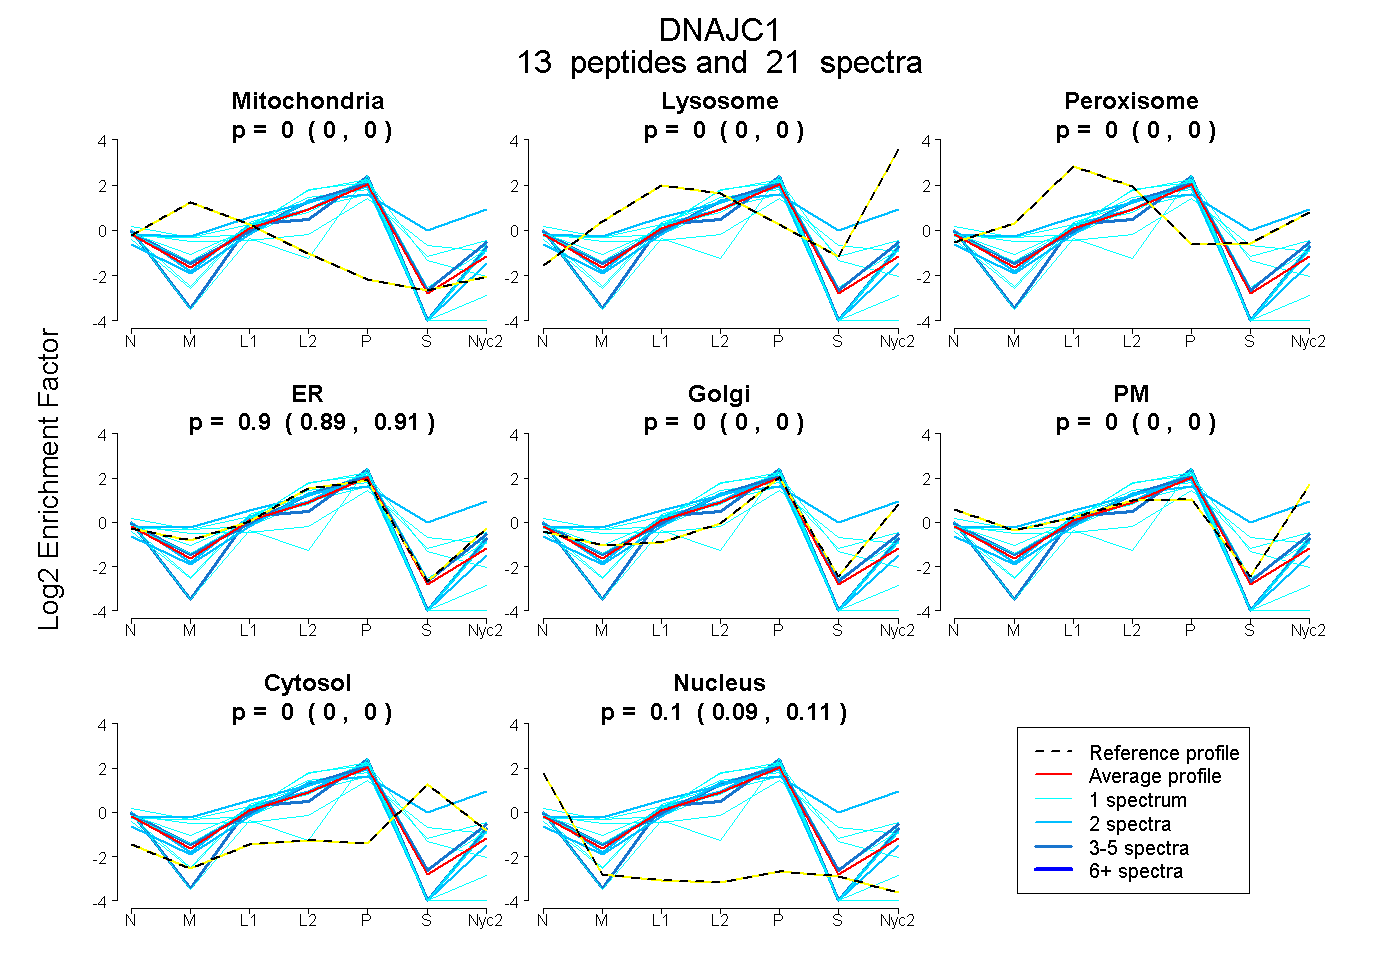
0.000 | 0.000
0.000 | 0.000
0.000 | 0.000
0.889 | 0.908
0.000 | 0.000
0.000 | 0.000
0.000 | 0.000
0.091 | 0.110
5peptides
spectra
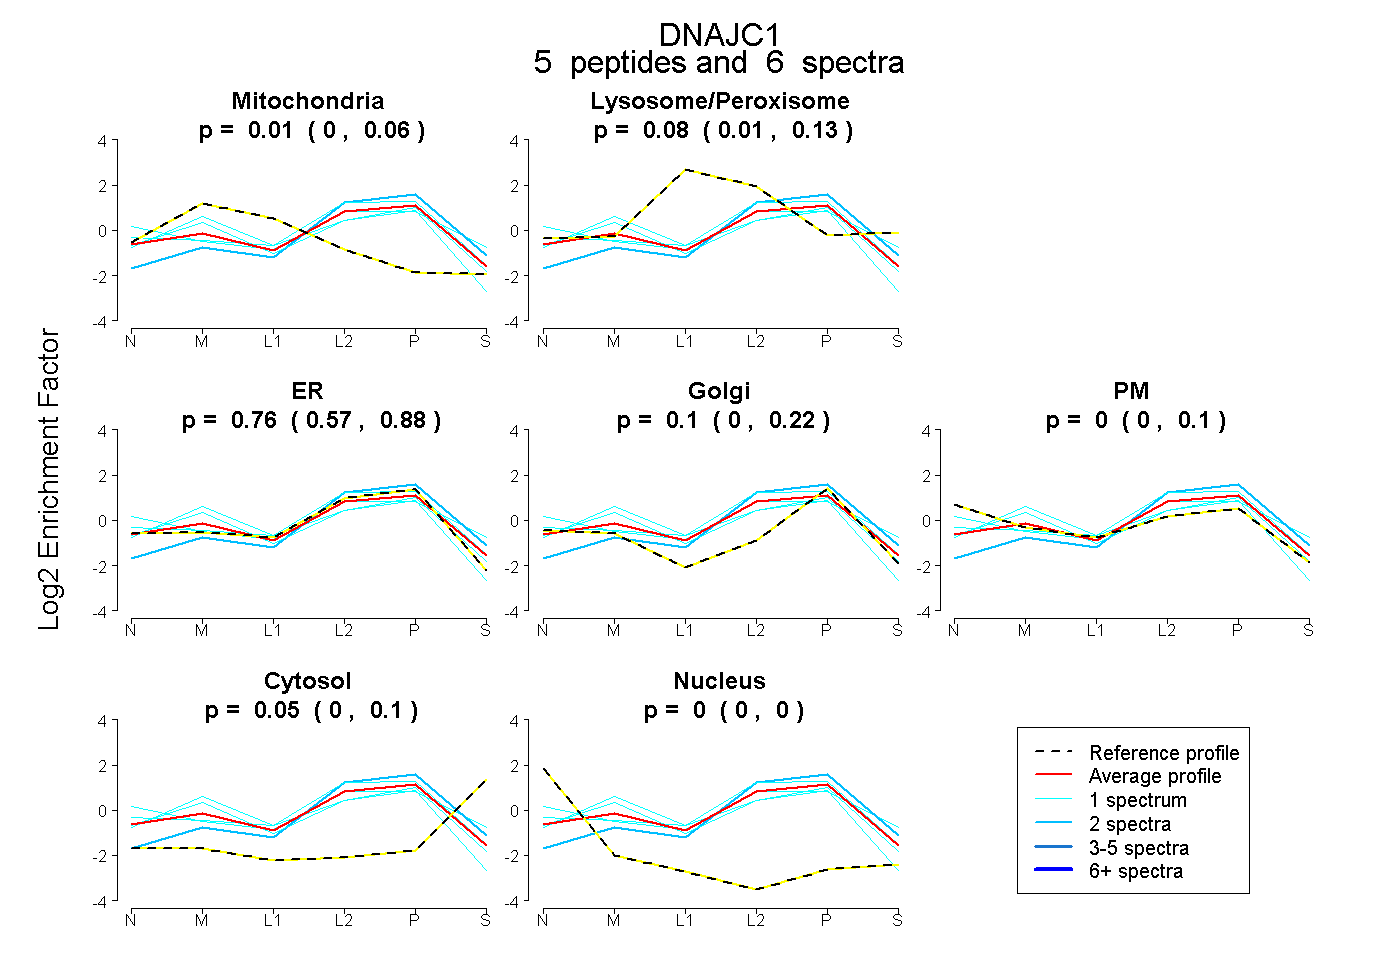
0.000 | 0.061
0.006 | 0.126
0.572 | 0.877
0.000 | 0.217
0.000 | 0.098
0.002 | 0.095
0.000 | 0.000
7peptides
spectra
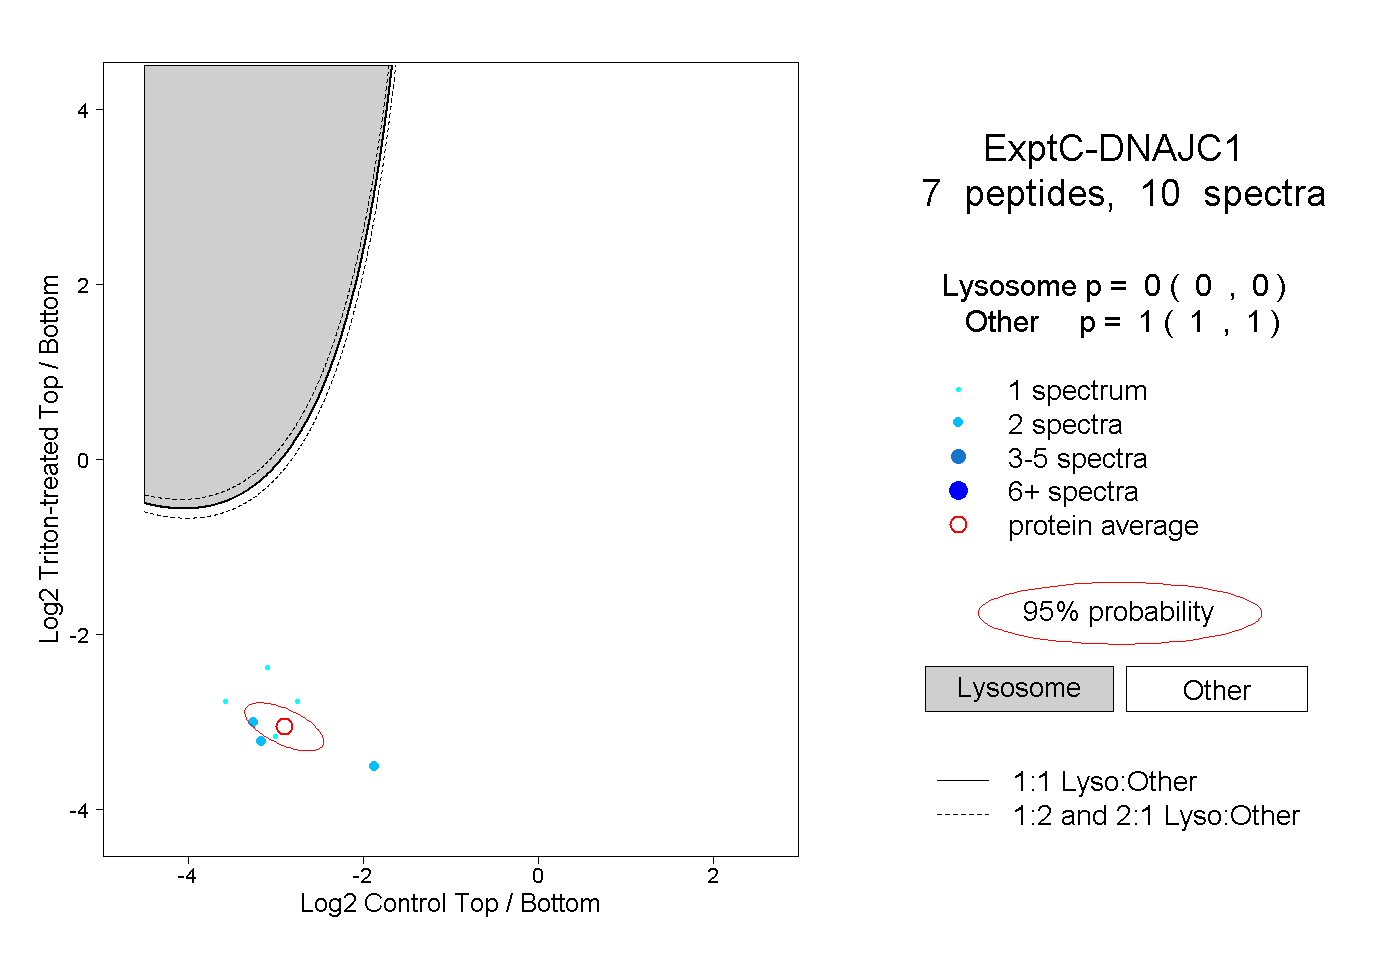
0.000 | 0.000
1.000 | 1.000