 13
13peptides
spectra
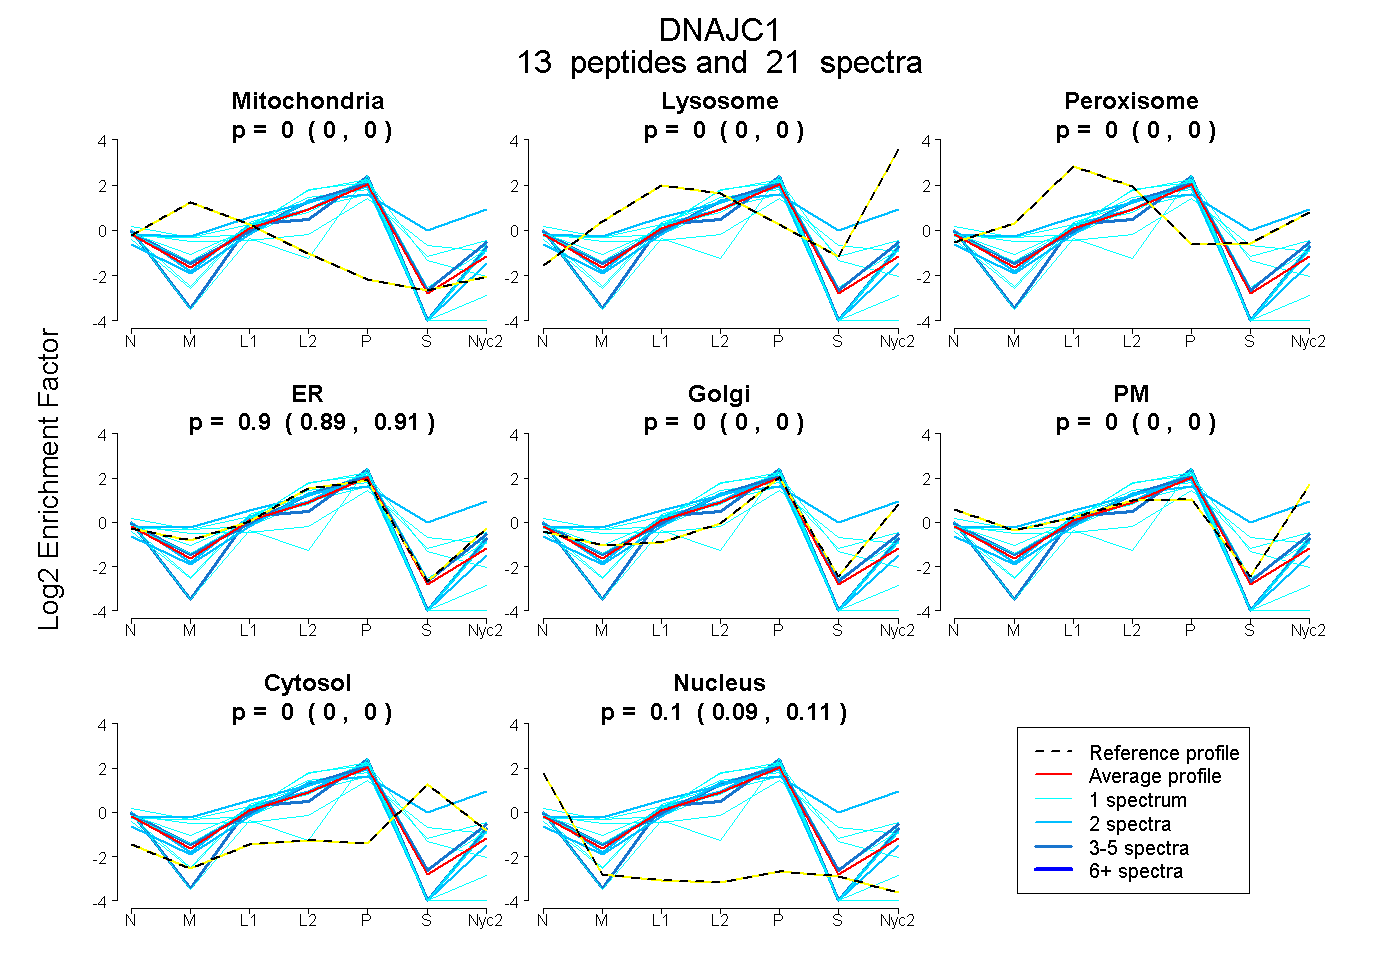
0.000 | 0.000
0.000 | 0.000
0.000 | 0.000
0.889 | 0.908
0.000 | 0.000
0.000 | 0.000
0.000 | 0.000
0.091 | 0.110
| Plot | Mito | Lyso | Perox | ER | Golgi | PM | Cytosol | Nucleus | |||||
| Expt A |
13 peptides |
21 spectra |
|
0.000 0.000 | 0.000 |
0.000 0.000 | 0.000 |
0.000 0.000 | 0.000 |
0.899 0.889 | 0.908 |
0.000 0.000 | 0.000 |
0.000 0.000 | 0.000 |
0.000 0.000 | 0.000 |
0.101 0.091 | 0.110 |
| 1 spectrum, QAPEWTEEDLSQLTR | 0.000 | 0.000 | 0.000 | 0.918 | 0.000 | 0.000 | 0.032 | 0.050 | ||
| 2 spectra, FPGGTPGR | 0.000 | 0.000 | 0.000 | 0.896 | 0.000 | 0.000 | 0.000 | 0.104 | ||
| 1 spectrum, IAHELGR | 0.000 | 0.000 | 0.000 | 0.742 | 0.000 | 0.000 | 0.217 | 0.041 | ||
| 4 spectra, DSVTSSPGMTR | 0.000 | 0.000 | 0.000 | 0.757 | 0.116 | 0.000 | 0.000 | 0.127 | ||
| 1 spectrum, LLELALQQYPK | 0.091 | 0.000 | 0.000 | 0.434 | 0.186 | 0.000 | 0.289 | 0.000 | ||
| 1 spectrum, YDDILINGLPDWR | 0.000 | 0.000 | 0.000 | 0.989 | 0.000 | 0.000 | 0.000 | 0.011 | ||
| 1 spectrum, VELETLHK | 0.000 | 0.000 | 0.000 | 0.895 | 0.000 | 0.000 | 0.000 | 0.105 | ||
| 2 spectra, QLVAIYEVLK | 0.000 | 0.229 | 0.000 | 0.401 | 0.072 | 0.000 | 0.297 | 0.000 | ||
| 1 spectrum, ALPHLIQDAGQFYAK | 0.002 | 0.000 | 0.088 | 0.681 | 0.060 | 0.000 | 0.169 | 0.000 | ||
| 1 spectrum, LSLTLHPDK | 0.150 | 0.000 | 0.000 | 0.734 | 0.000 | 0.000 | 0.000 | 0.116 | ||
| 3 spectra, QLDELLSR | 0.000 | 0.000 | 0.000 | 0.924 | 0.033 | 0.000 | 0.000 | 0.044 | ||
| 1 spectrum, IATALPDDIITQR | 0.000 | 0.000 | 0.000 | 0.053 | 0.743 | 0.000 | 0.000 | 0.204 | ||
| 2 spectra, QPVFYYR | 0.097 | 0.000 | 0.000 | 0.903 | 0.000 | 0.000 | 0.000 | 0.000 |
| Plot | Mito | Lyso or Perox | ER | Golgi | PM | Cytosol | Nucleus | ||||||
| Expt B |
5 peptides |
6 spectra |
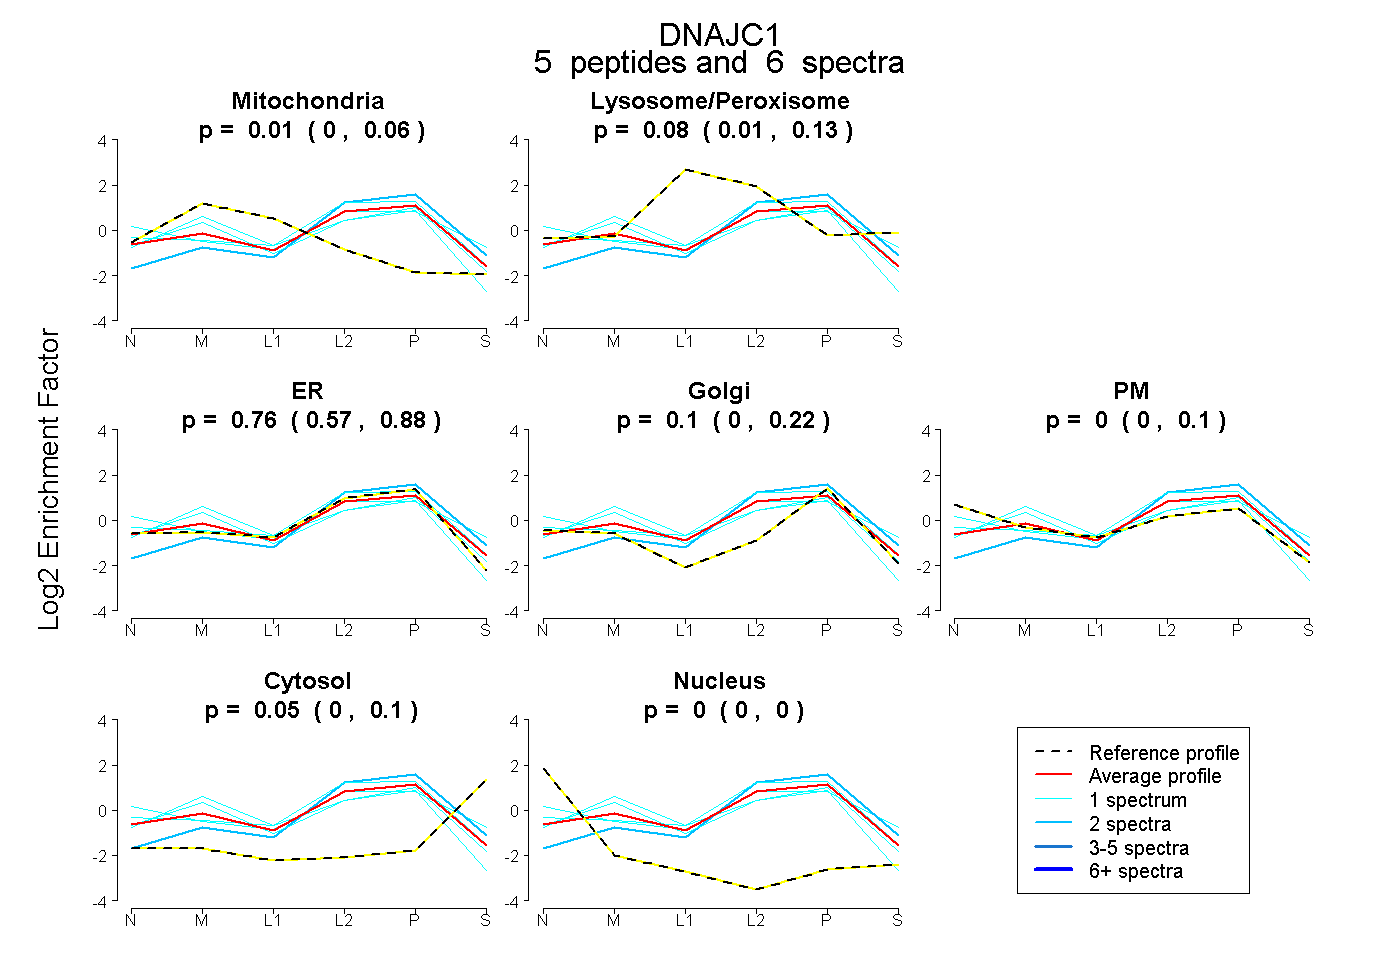 |
0.012 0.000 | 0.061 |
0.075 0.006 | 0.126 |
0.755 0.572 | 0.877 |
0.103 0.000 | 0.217 |
0.000 0.000 | 0.098 |
0.055 0.002 | 0.095 |
0.000 0.000 | 0.000 |
|||
| Plot | Lyso | Other | |||||||||||
| Expt C |
7 peptides |
10 spectra |
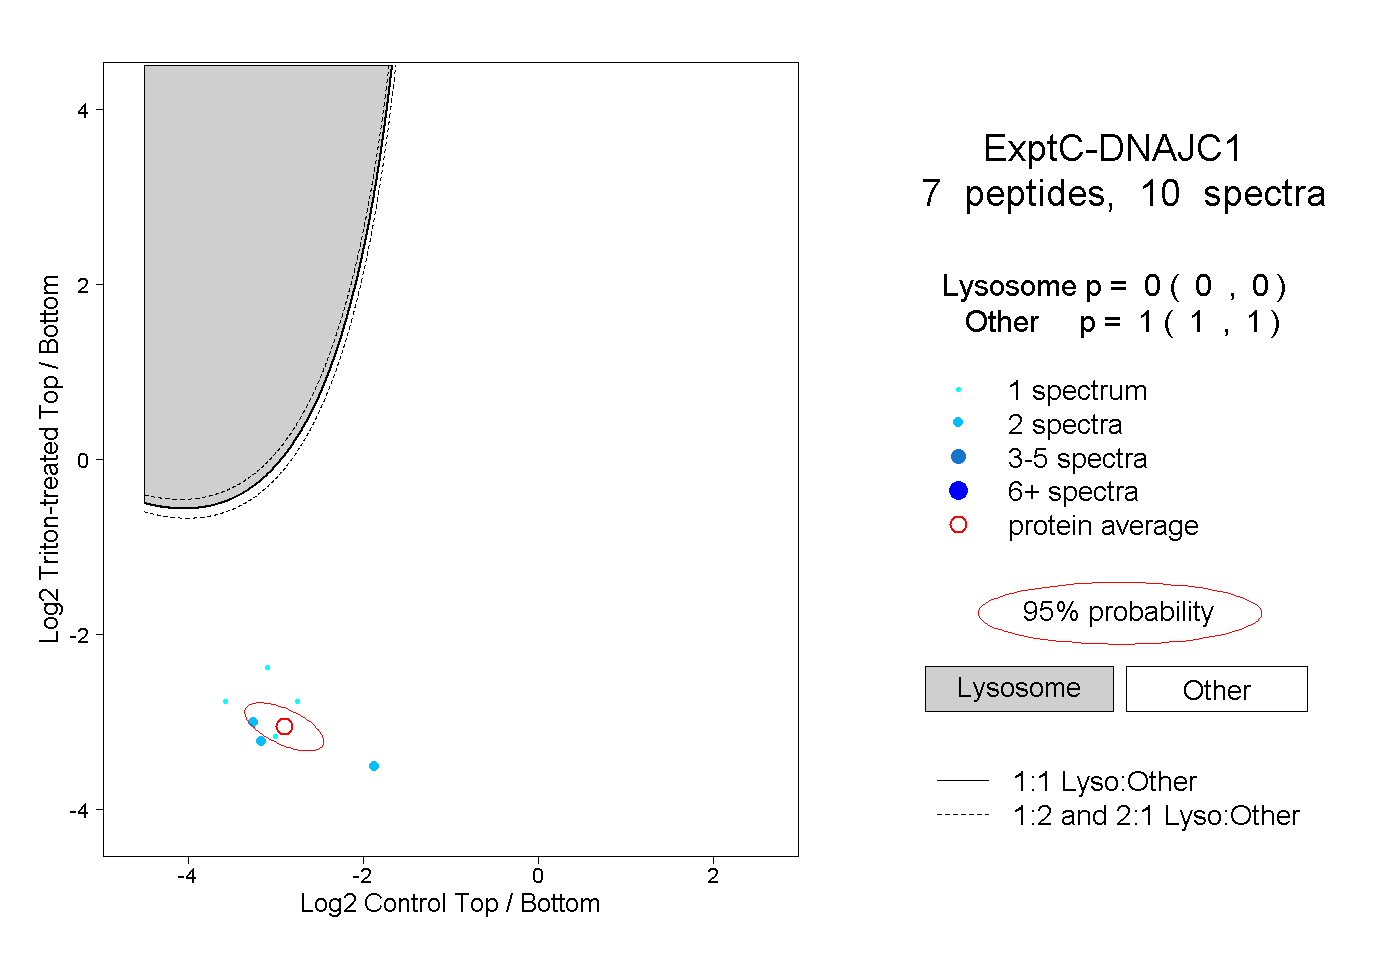 |
0.000 0.000 | 0.000 |
1.000 1.000 | 1.000 |