 22
22peptides
spectra
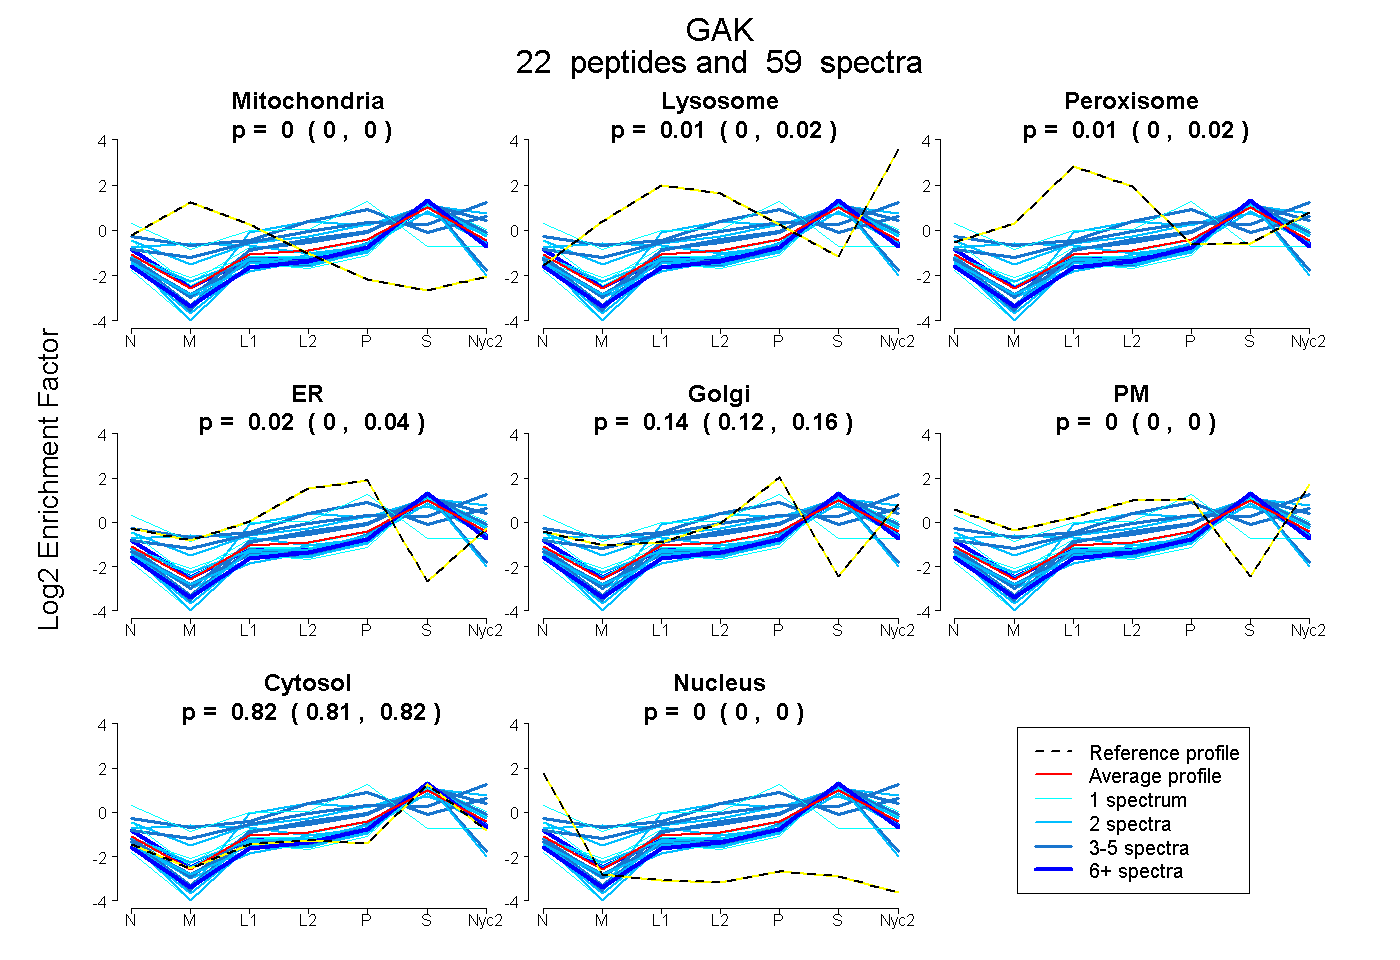
0.000 | 0.000
0.000 | 0.022
0.000 | 0.024
0.000 | 0.040
0.119 | 0.162
0.000 | 0.000
0.809 | 0.823
0.000 | 0.000
4peptides
spectra
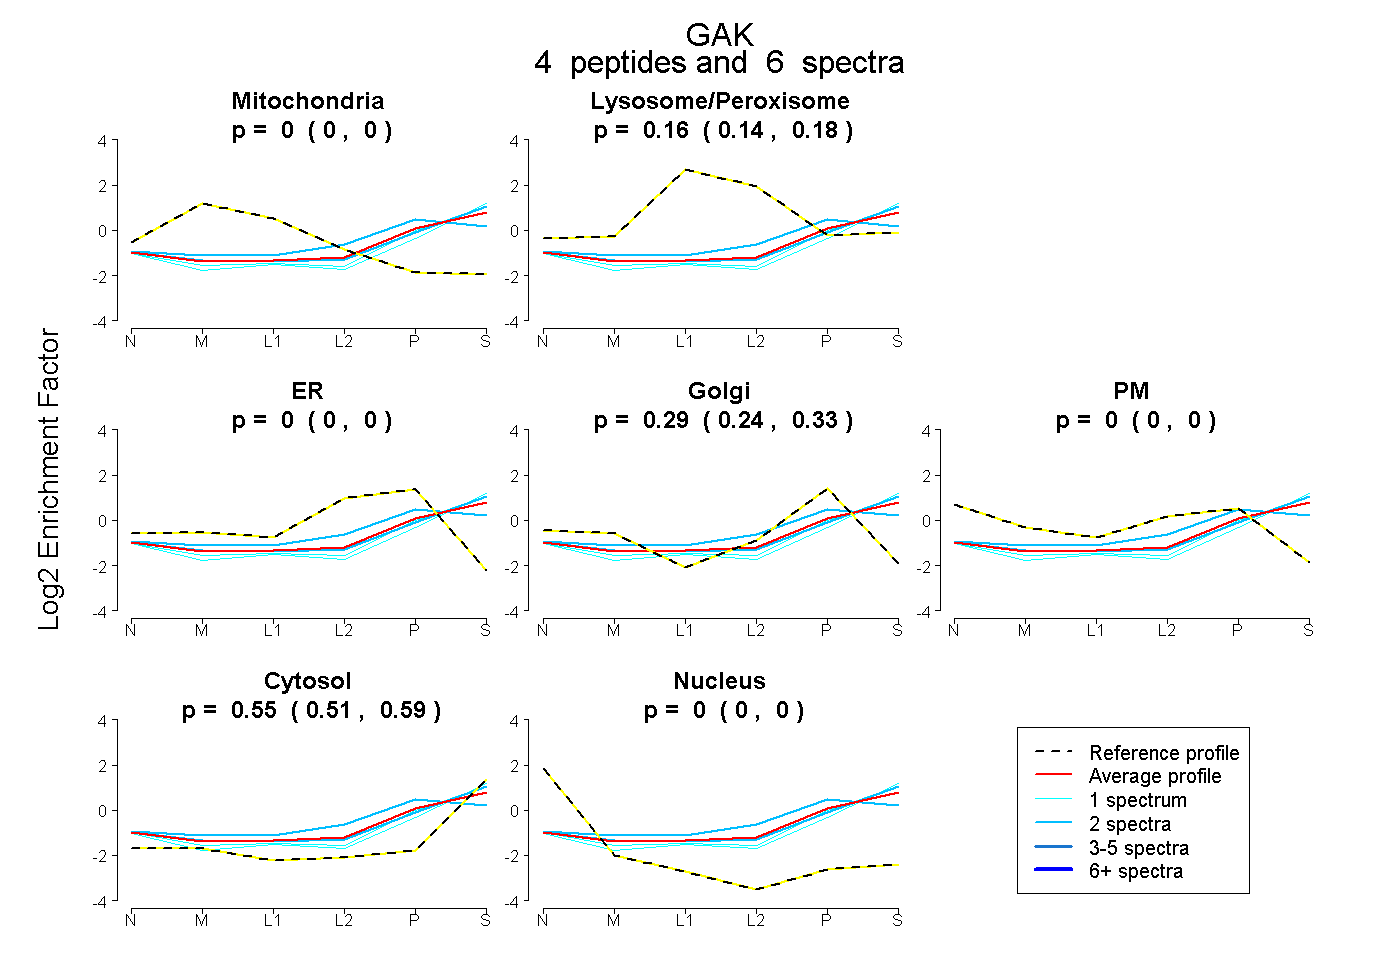
0.000 | 0.000
0.135 | 0.177
0.000 | 0.000
0.240 | 0.331
0.000 | 0.000
0.509 | 0.589
0.000 | 0.000
24peptides
spectra
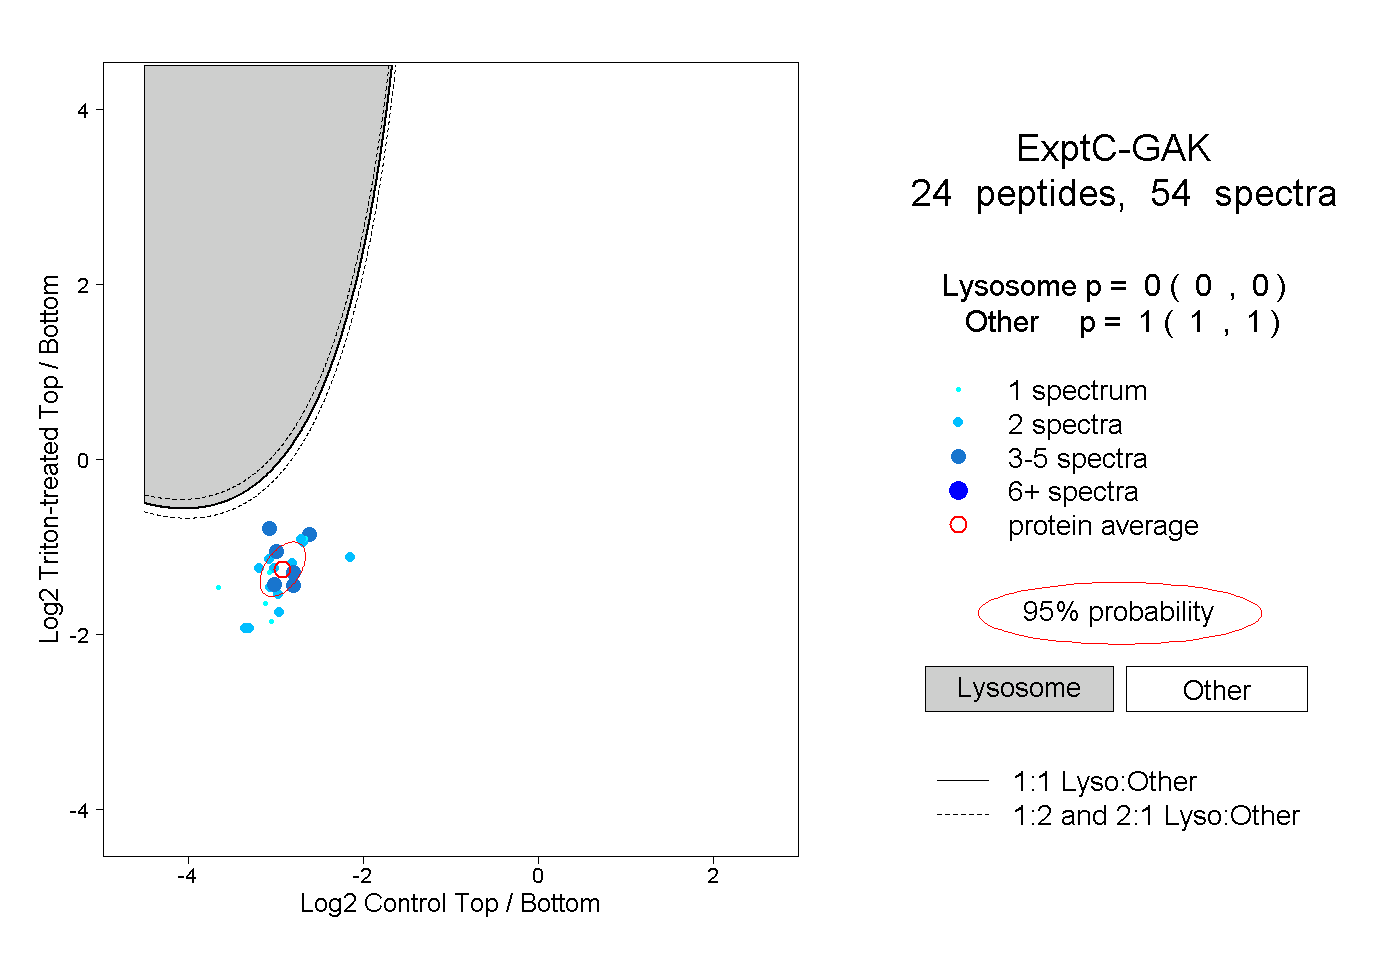
0.000 | 0.000
1.000 | 1.000
3peptides
spectra
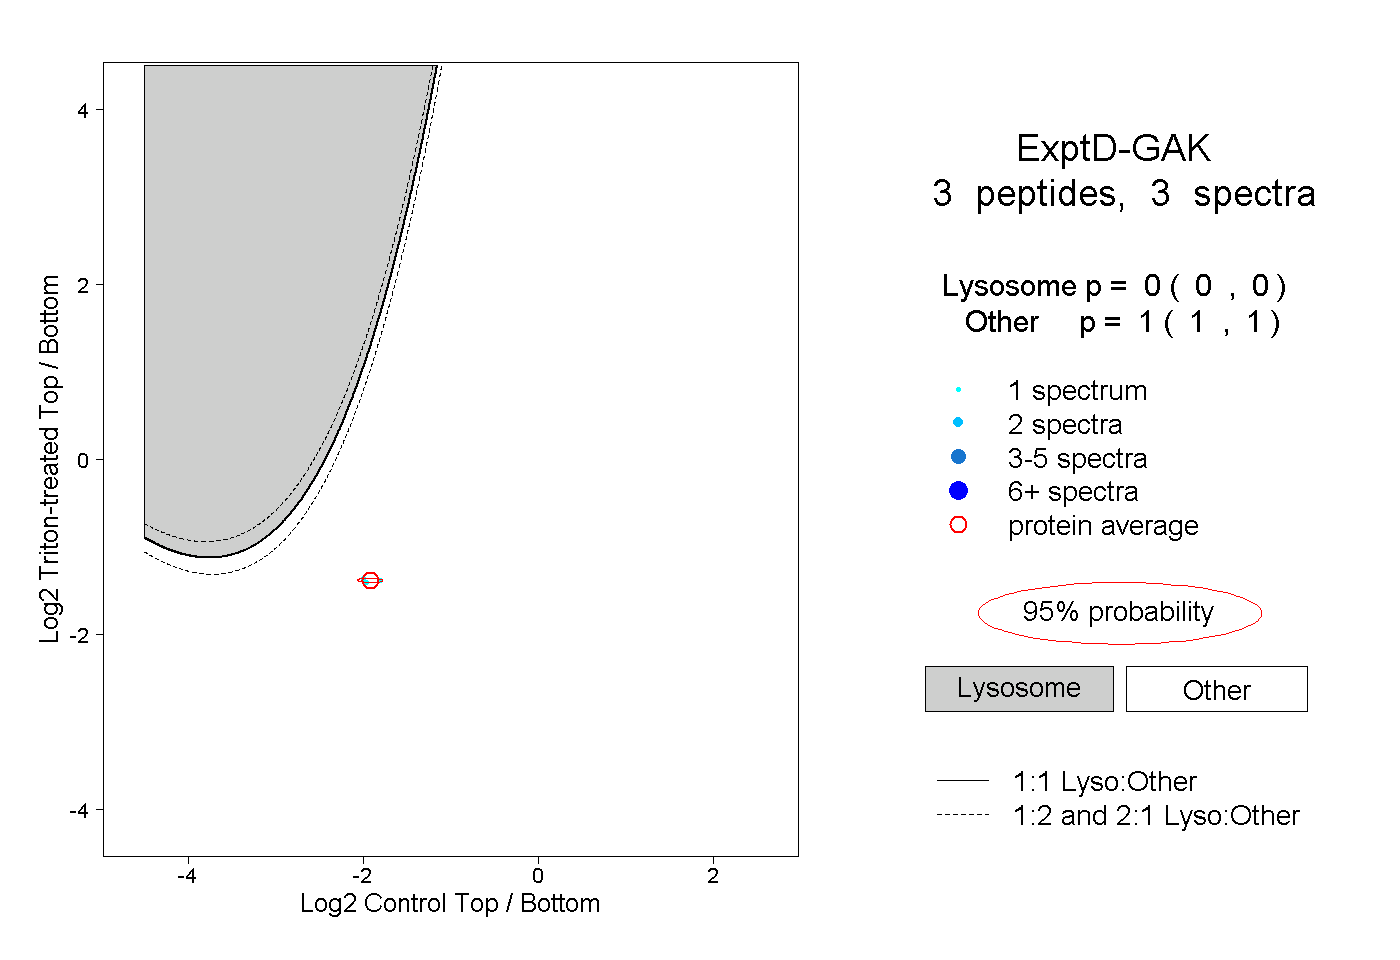
0.000 | 0.000
1.000 | 1.000