 22
22peptides
spectra
0.000 | 0.000
0.000 | 0.022
0.000 | 0.024
0.000 | 0.040
0.119 | 0.162
0.000 | 0.000
0.809 | 0.823
0.000 | 0.000
| Plot | Mito | Lyso | Perox | ER | Golgi | PM | Cytosol | Nucleus | |||||
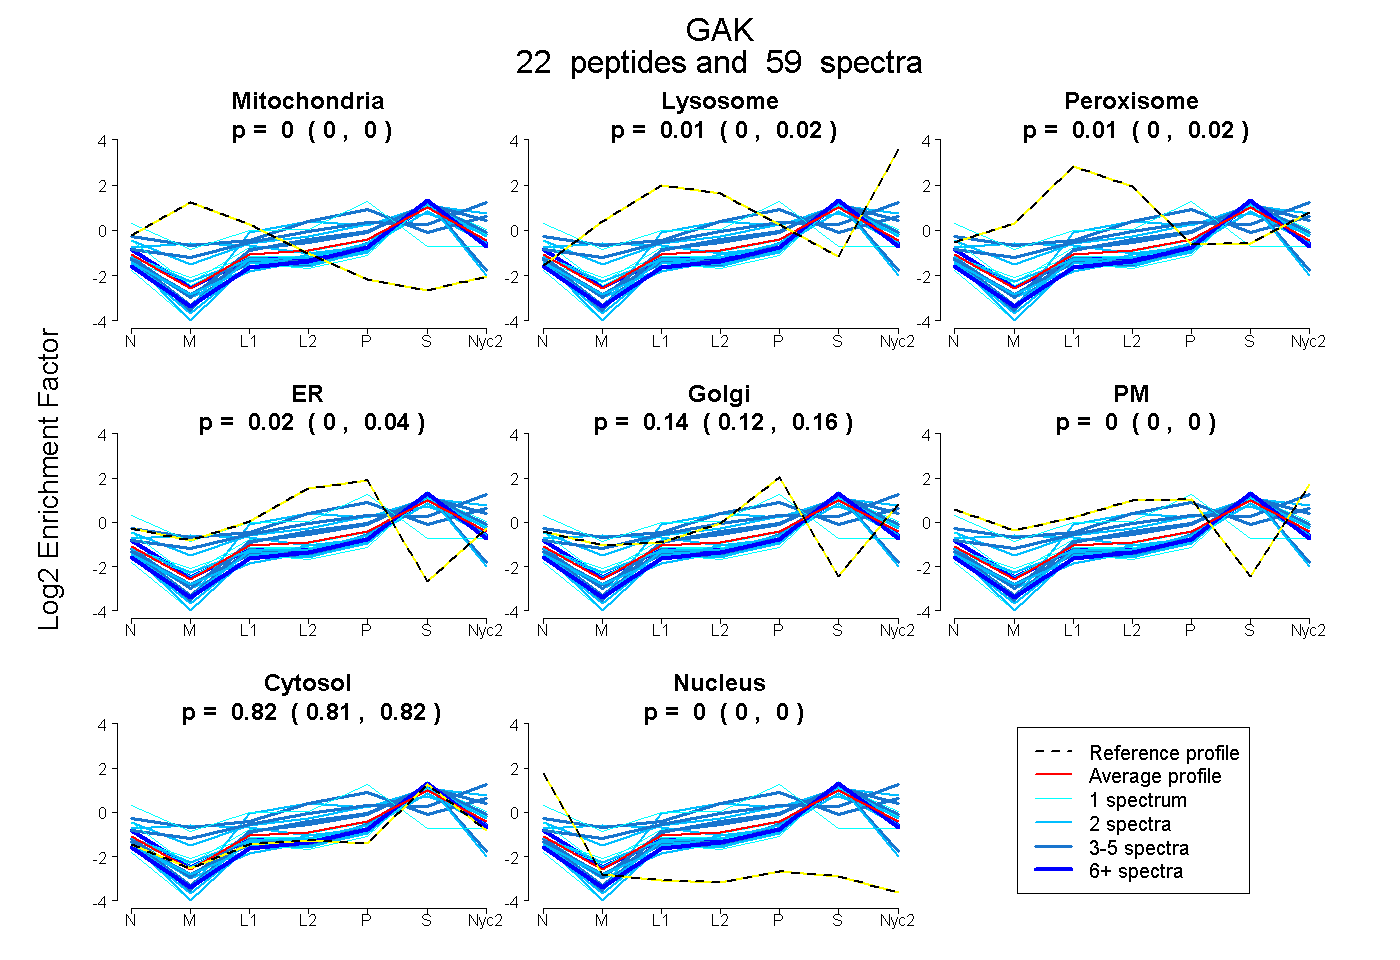
| Expt A |
22 peptides |
59 spectra |
|
0.000 0.000 | 0.000 |
0.012 0.000 | 0.022 |
0.009 0.000 | 0.024 |
0.020 0.000 | 0.040 |
0.142 0.119 | 0.162 |
0.000 0.000 | 0.000 |
0.817 0.809 | 0.823 |
0.000 0.000 | 0.000 |
| 4 spectra, IFYQTCR | 0.000 | 0.000 | 0.000 | 0.005 | 0.000 | 0.000 | 0.935 | 0.060 | ||
| 1 spectrum, LFLDAK | 0.000 | 0.000 | 0.040 | 0.000 | 0.091 | 0.000 | 0.869 | 0.000 | ||
| 2 spectra, VTTTSQEYDR | 0.000 | 0.037 | 0.000 | 0.000 | 0.112 | 0.000 | 0.851 | 0.000 | ||
| 1 spectrum, VTECGWAVR | 0.000 | 0.000 | 0.000 | 0.000 | 0.000 | 0.153 | 0.847 | 0.000 | ||
| 2 spectra, EYALK | 0.162 | 0.031 | 0.118 | 0.000 | 0.058 | 0.000 | 0.631 | 0.000 | ||
| 2 spectra, ATGQPYEQSAK | 0.000 | 0.241 | 0.000 | 0.091 | 0.000 | 0.000 | 0.669 | 0.000 | ||
| 3 spectra, LLDWIEGK | 0.000 | 0.129 | 0.000 | 0.000 | 0.120 | 0.000 | 0.751 | 0.000 | ||
| 5 spectra, ILFSNR | 0.000 | 0.293 | 0.000 | 0.000 | 0.218 | 0.034 | 0.456 | 0.000 | ||
| 2 spectra, CPPGIWPSHK | 0.000 | 0.000 | 0.154 | 0.027 | 0.202 | 0.048 | 0.569 | 0.000 | ||
| 2 spectra, YDLDACDIQEK | 0.000 | 0.000 | 0.000 | 0.007 | 0.000 | 0.000 | 0.935 | 0.057 | ||
| 1 spectrum, AVLVVHPDK | 0.000 | 0.139 | 0.000 | 0.000 | 0.051 | 0.000 | 0.810 | 0.000 | ||
| 1 spectrum, GDLDISYITSR | 0.000 | 0.000 | 0.000 | 0.000 | 0.000 | 0.000 | 1.000 | 0.000 | ||
| 2 spectra, KPGAGEDTPR | 0.000 | 0.000 | 0.000 | 0.000 | 0.000 | 0.000 | 1.000 | 0.000 | ||
| 1 spectrum, STLGGR | 0.000 | 0.000 | 0.140 | 0.404 | 0.170 | 0.000 | 0.224 | 0.062 | ||
| 2 spectra, FGKPELPR | 0.000 | 0.000 | 0.000 | 0.000 | 0.043 | 0.000 | 0.957 | 0.000 | ||
| 6 spectra, AMVEEEITR | 0.000 | 0.000 | 0.000 | 0.000 | 0.067 | 0.042 | 0.891 | 0.000 | ||
| 4 spectra, HPGHYAVYNLSPR | 0.000 | 0.039 | 0.162 | 0.000 | 0.319 | 0.177 | 0.302 | 0.000 | ||
| 3 spectra, LSIAEVVR | 0.000 | 0.000 | 0.000 | 0.000 | 0.084 | 0.000 | 0.916 | 0.000 | ||
| 4 spectra, DTDPFK | 0.000 | 0.041 | 0.000 | 0.035 | 0.104 | 0.000 | 0.821 | 0.000 | ||
| 2 spectra, AIIQEVCFLK | 0.000 | 0.000 | 0.000 | 0.000 | 0.000 | 0.000 | 0.925 | 0.075 | ||
| 2 spectra, SVVMTPVPLFSK | 0.000 | 0.000 | 0.000 | 0.000 | 0.001 | 0.000 | 0.999 | 0.000 | ||
| 7 spectra, YTVFHDLIR | 0.000 | 0.000 | 0.000 | 0.000 | 0.015 | 0.000 | 0.985 | 0.000 |
| Plot | Mito | Lyso or Perox | ER | Golgi | PM | Cytosol | Nucleus | ||||||
| Expt B |
4 peptides |
6 spectra |
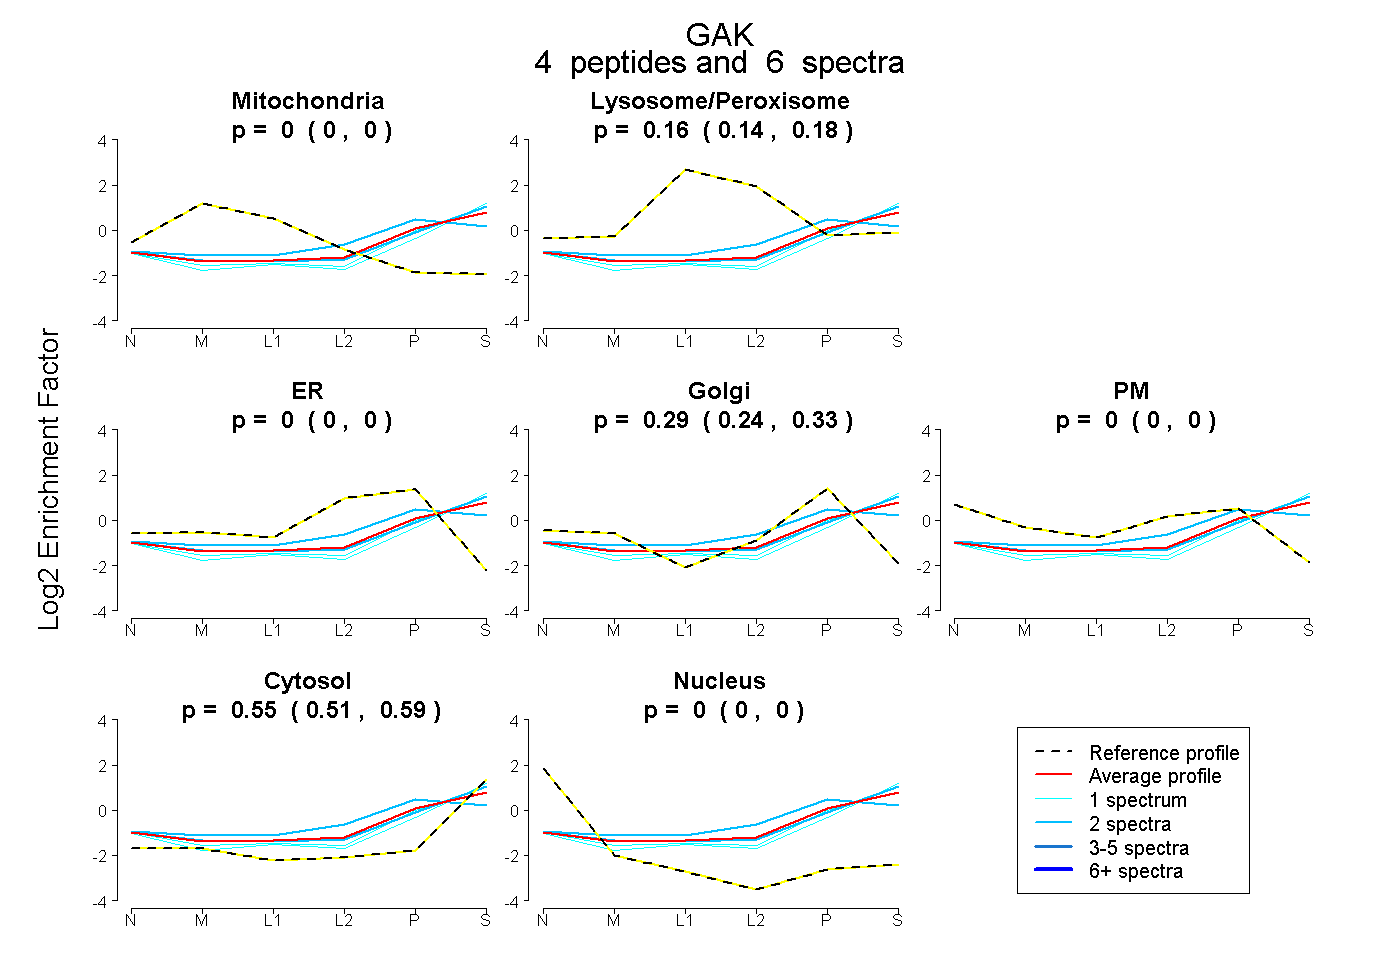 |
0.000 0.000 | 0.000 |
0.158 0.135 | 0.177 |
0.000 0.000 | 0.000 |
0.290 0.240 | 0.331 |
0.000 0.000 | 0.000 |
0.552 0.509 | 0.589 |
0.000 0.000 | 0.000 |
|||
| Plot | Lyso | Other | |||||||||||
| Expt C |
24 peptides |
54 spectra |
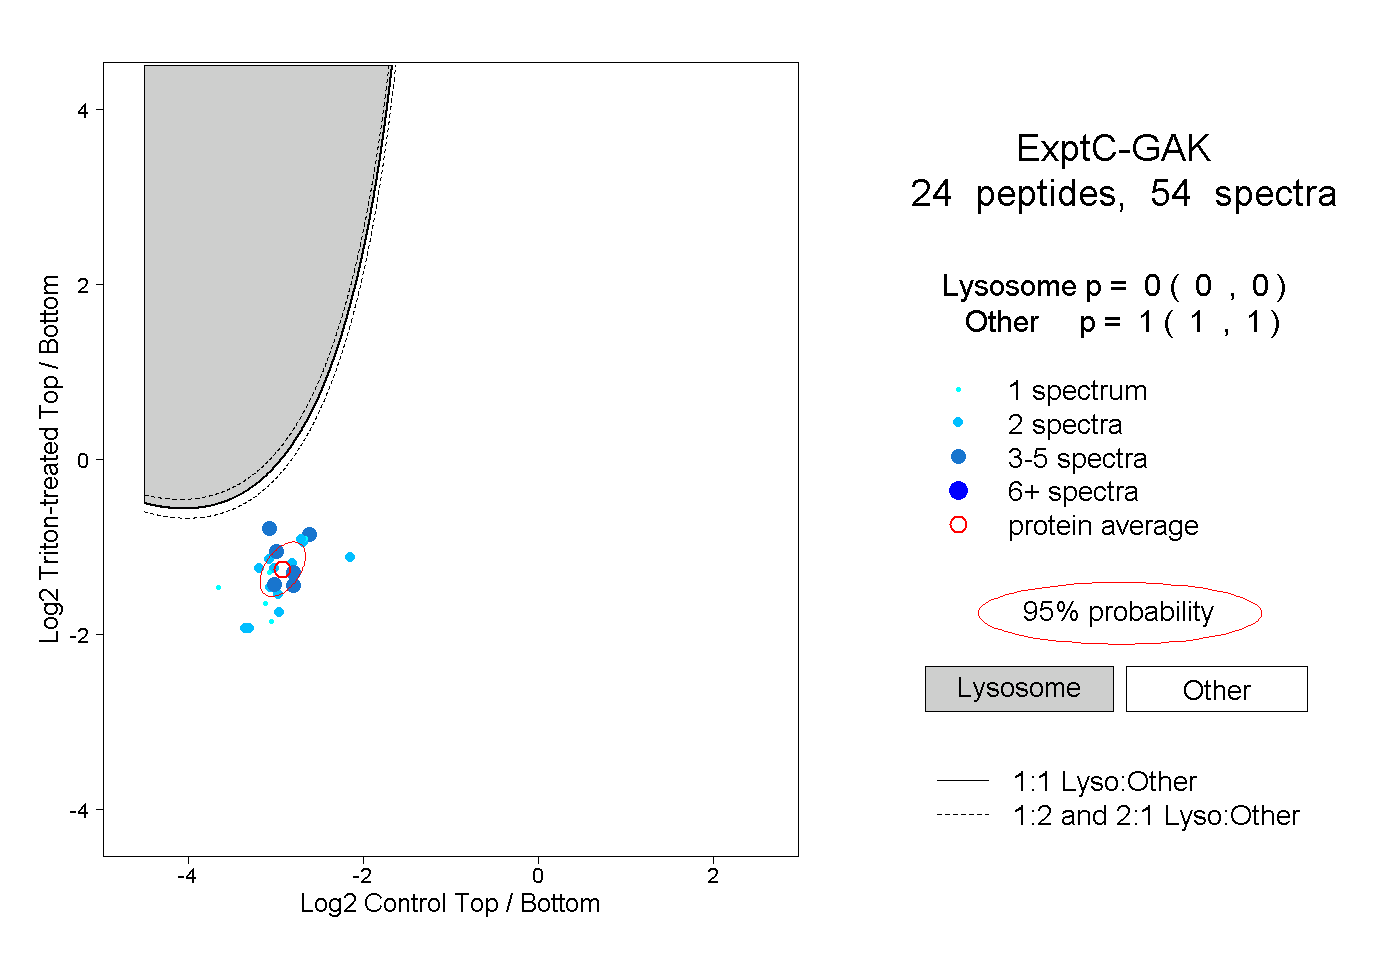 |
0.000 0.000 | 0.000 |
1.000 1.000 | 1.000 |
||||||||
| Plot | Lyso | Other | |||||||||||
| Expt D |
3 peptides |
3 spectra |
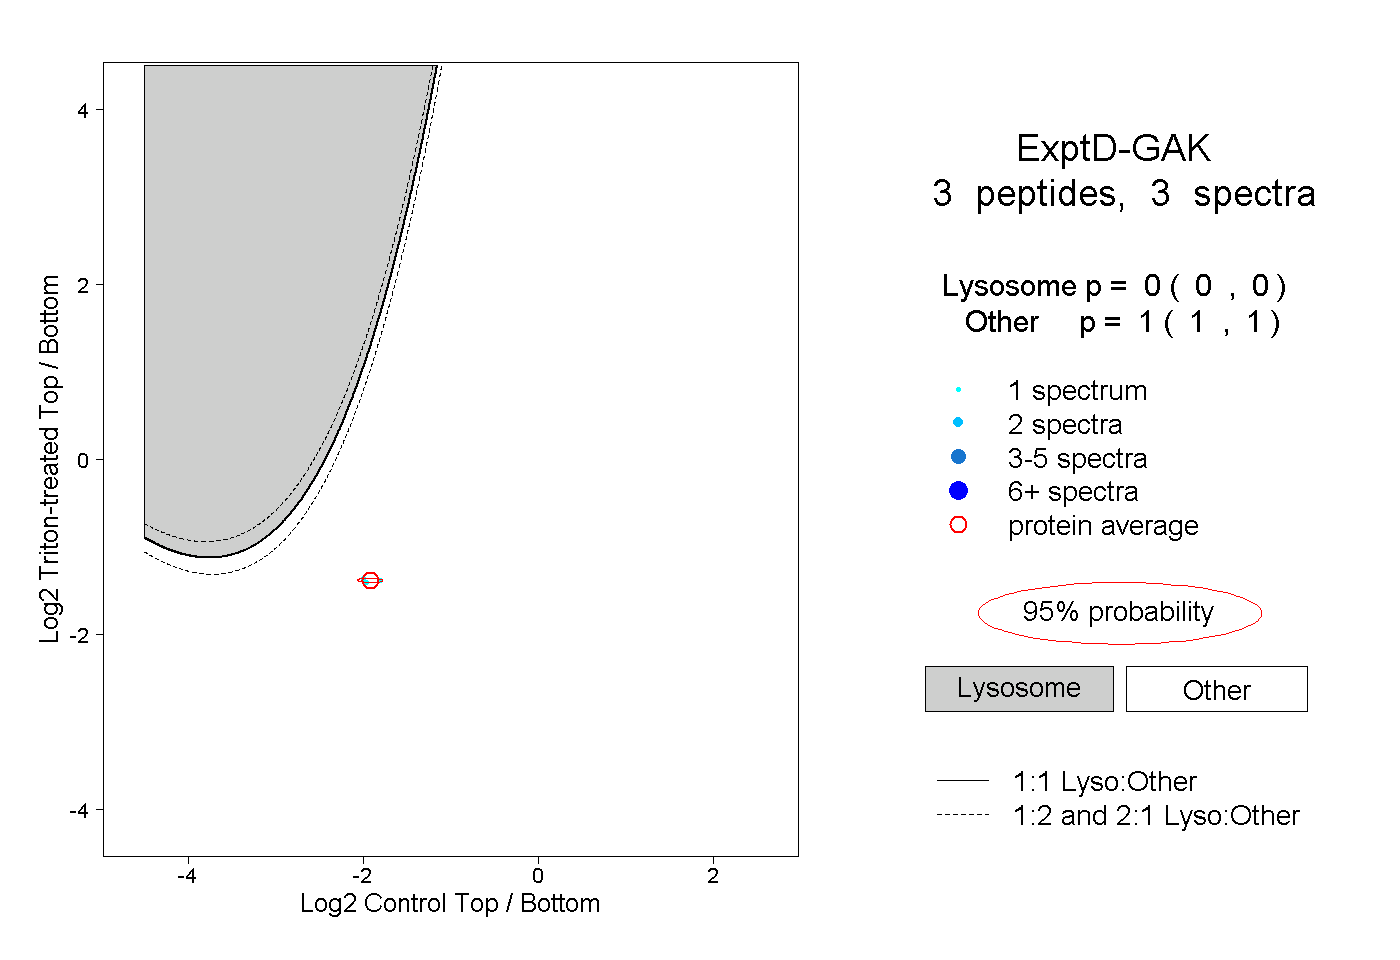 |
0.000 0.000 | 0.000 |
1.000 1.000 | 1.000 |