 4
4peptides
spectra
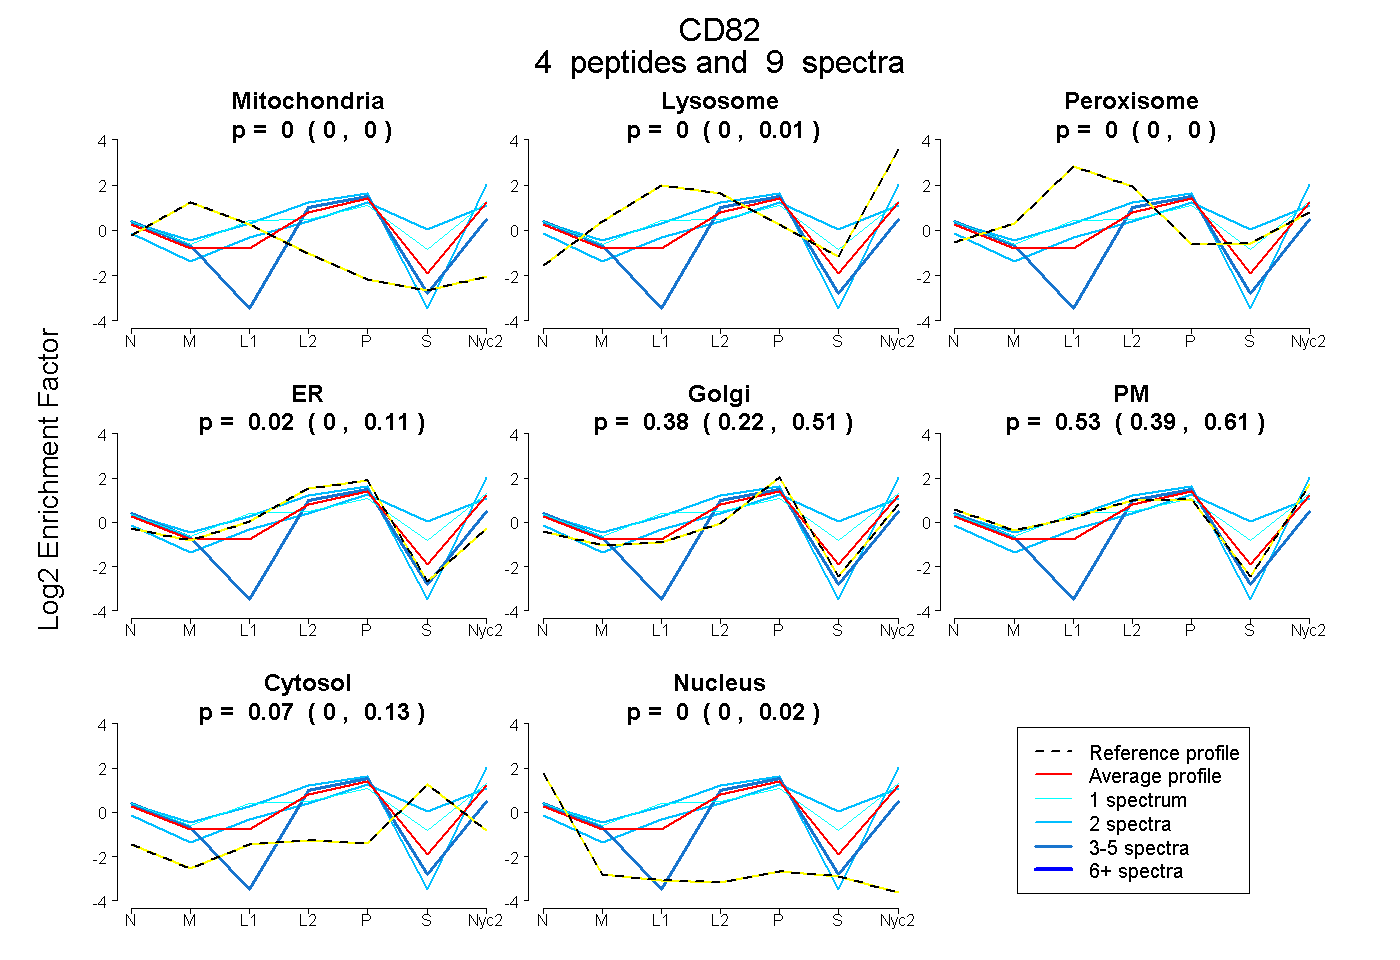
0.000 | 0.000
0.000 | 0.011
0.000 | 0.000
0.000 | 0.111
0.215 | 0.509
0.394 | 0.605
0.000 | 0.126
0.000 | 0.022
1peptide
spectrum
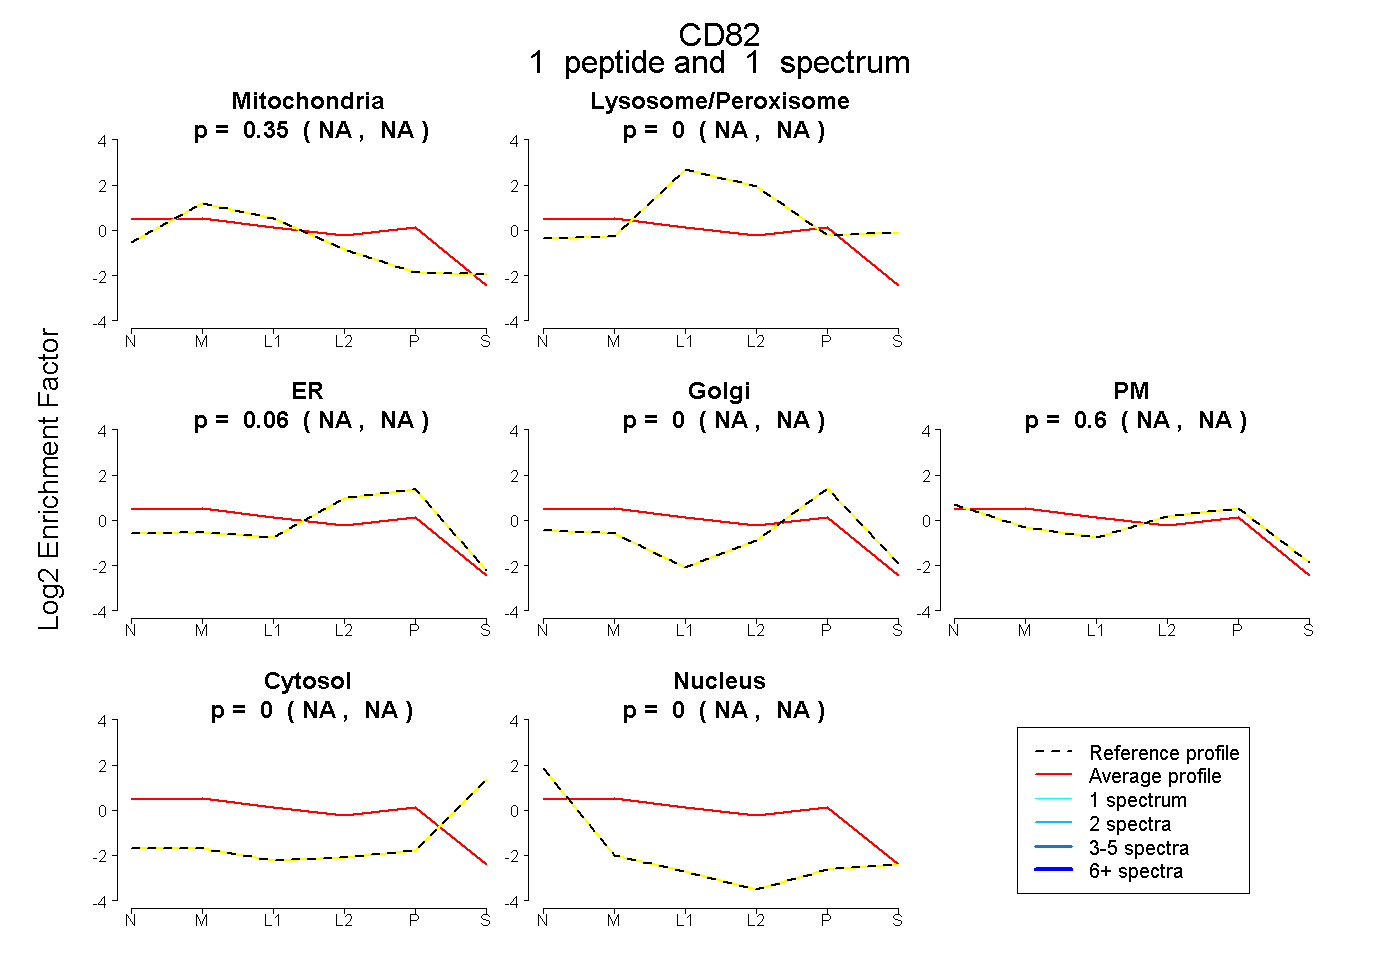
NA | NA
NA | NA
NA | NA
NA | NA
NA | NA
NA | NA
NA | NA
4peptides
spectra
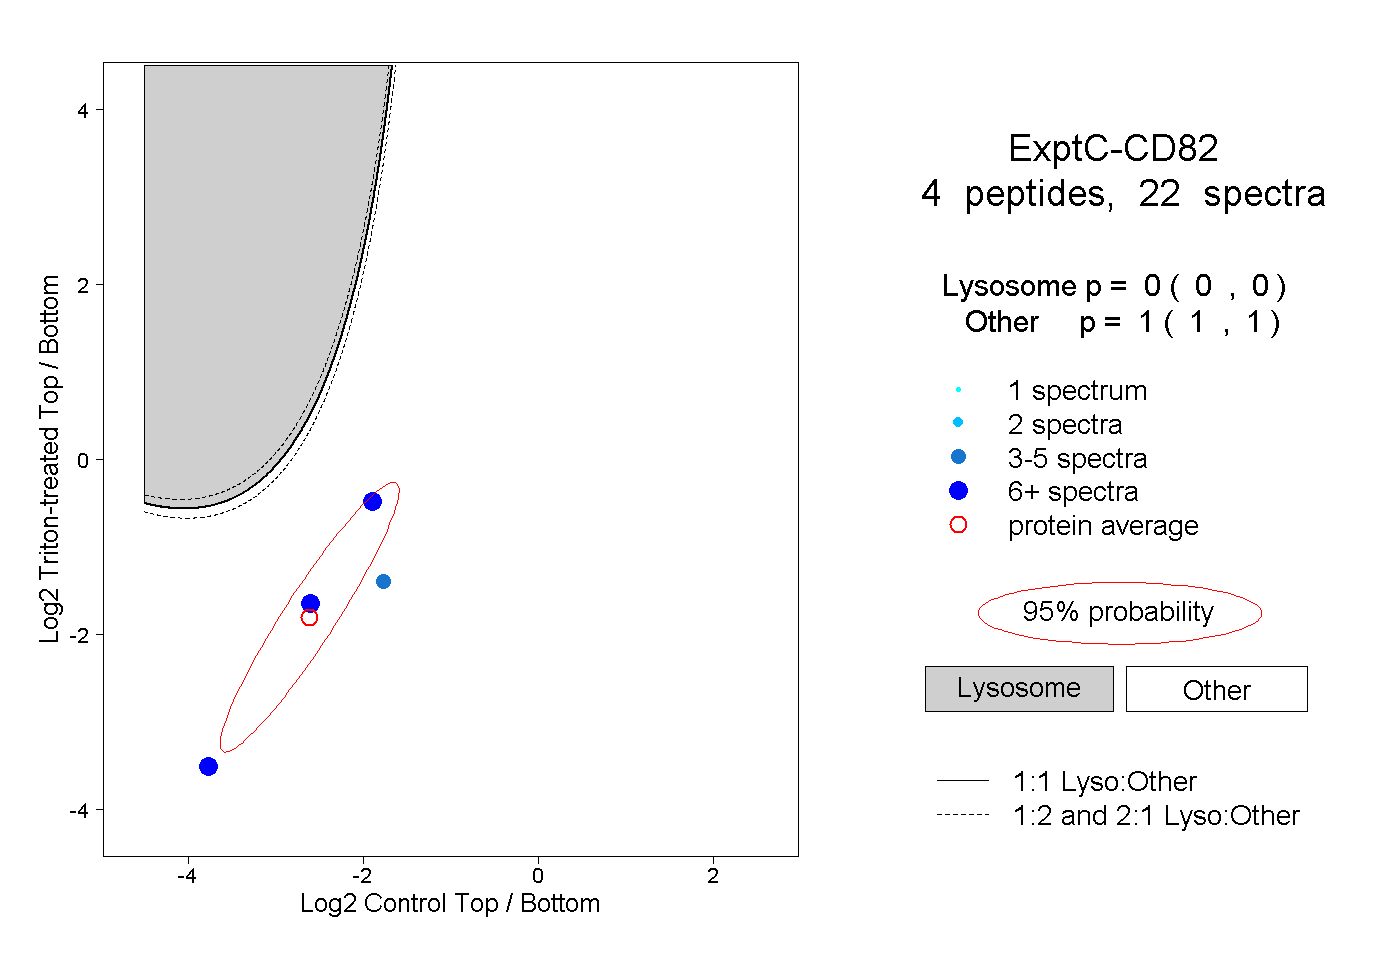
0.000 | 0.000
1.000 | 1.000