 4
4peptides
spectra
0.000 | 0.000
0.000 | 0.011
0.000 | 0.000
0.000 | 0.111
0.215 | 0.509
0.394 | 0.605
0.000 | 0.126
0.000 | 0.022
| Plot | Mito | Lyso | Perox | ER | Golgi | PM | Cytosol | Nucleus | |||||
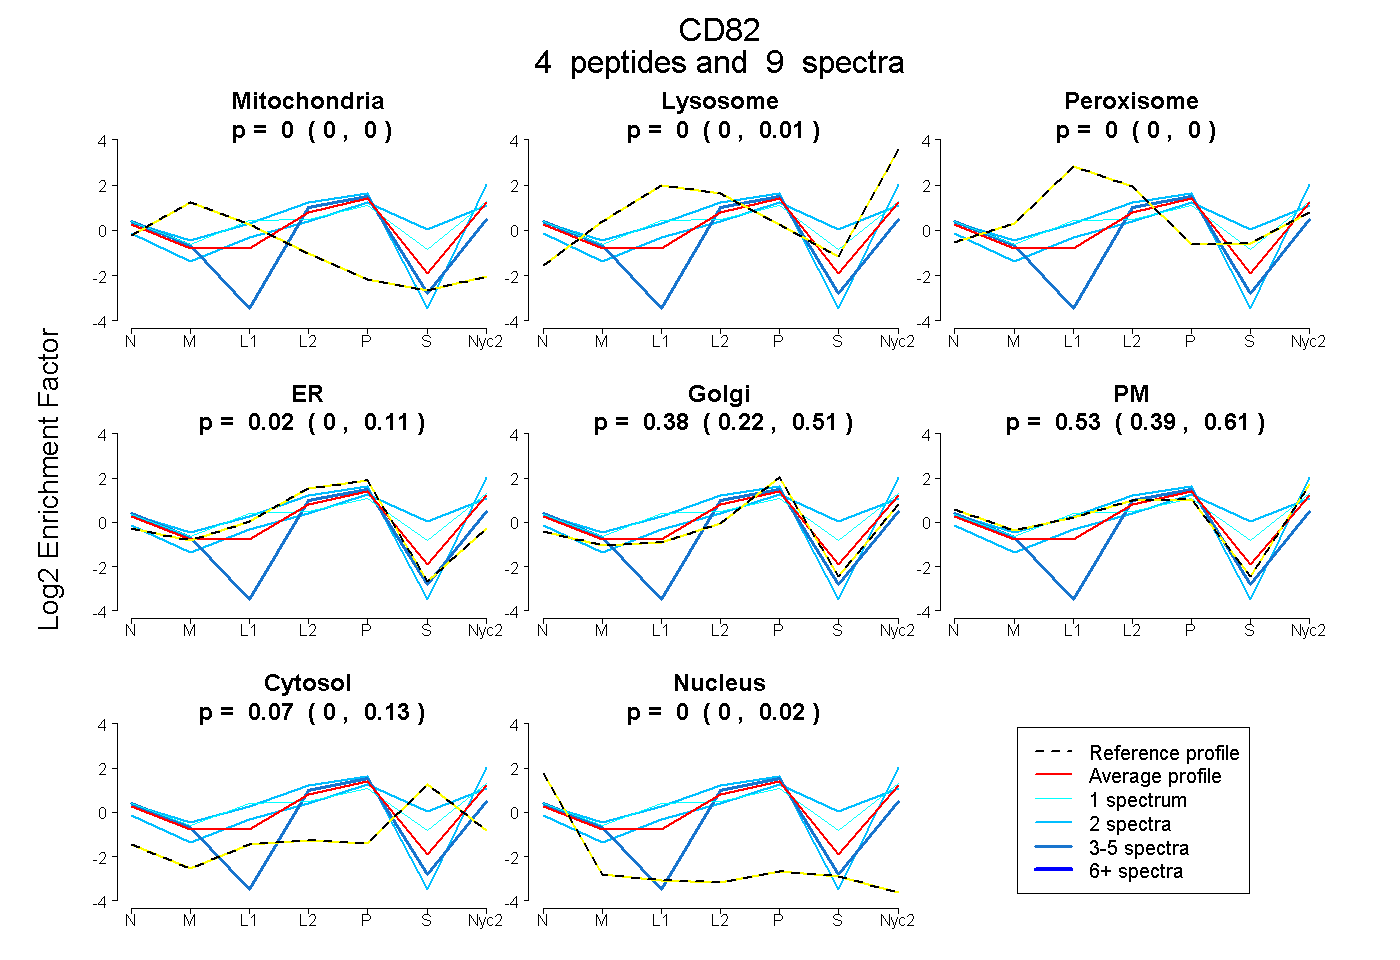
| Expt A |
4 peptides |
9 spectra |
|
0.000 0.000 | 0.000 |
0.000 0.000 | 0.011 |
0.000 0.000 | 0.000 |
0.017 0.000 | 0.111 |
0.377 0.215 | 0.509 |
0.532 0.394 | 0.605 |
0.074 0.000 | 0.126 |
0.000 0.000 | 0.022 |
| 1 spectrum, YIHSEDYSK | 0.000 | 0.034 | 0.143 | 0.000 | 0.105 | 0.560 | 0.157 | 0.000 | ||
| 2 spectra, EEAWDYVQAQVK | 0.000 | 0.000 | 0.000 | 0.069 | 0.000 | 0.931 | 0.000 | 0.000 | ||
| 4 spectra, TTYPCSCEK | 0.000 | 0.000 | 0.000 | 0.029 | 0.852 | 0.000 | 0.000 | 0.118 | ||
| 2 spectra, GAGCVK | 0.000 | 0.154 | 0.000 | 0.000 | 0.259 | 0.257 | 0.330 | 0.000 |
| Plot | Mito | Lyso or Perox | ER | Golgi | PM | Cytosol | Nucleus | ||||||
| Expt B |
1 peptide |
1 spectrum |
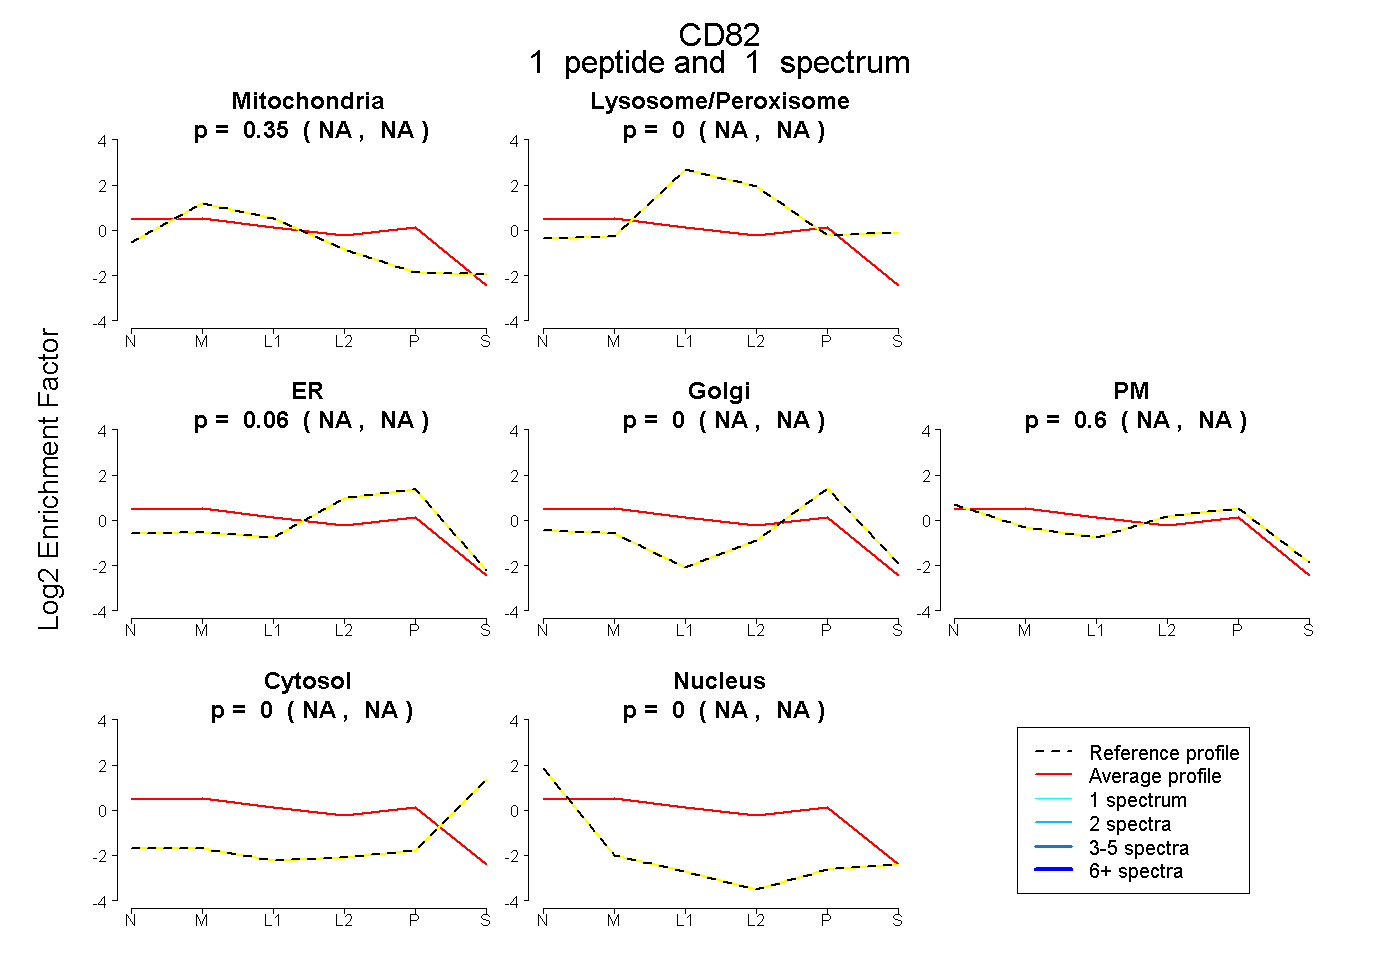 |
0.345 NA | NA |
0.000 NA | NA |
0.059 NA | NA |
0.000 NA | NA |
0.596 NA | NA |
0.000 NA | NA |
0.000 NA | NA |
|||
| Plot | Lyso | Other | |||||||||||
| Expt C |
4 peptides |
22 spectra |
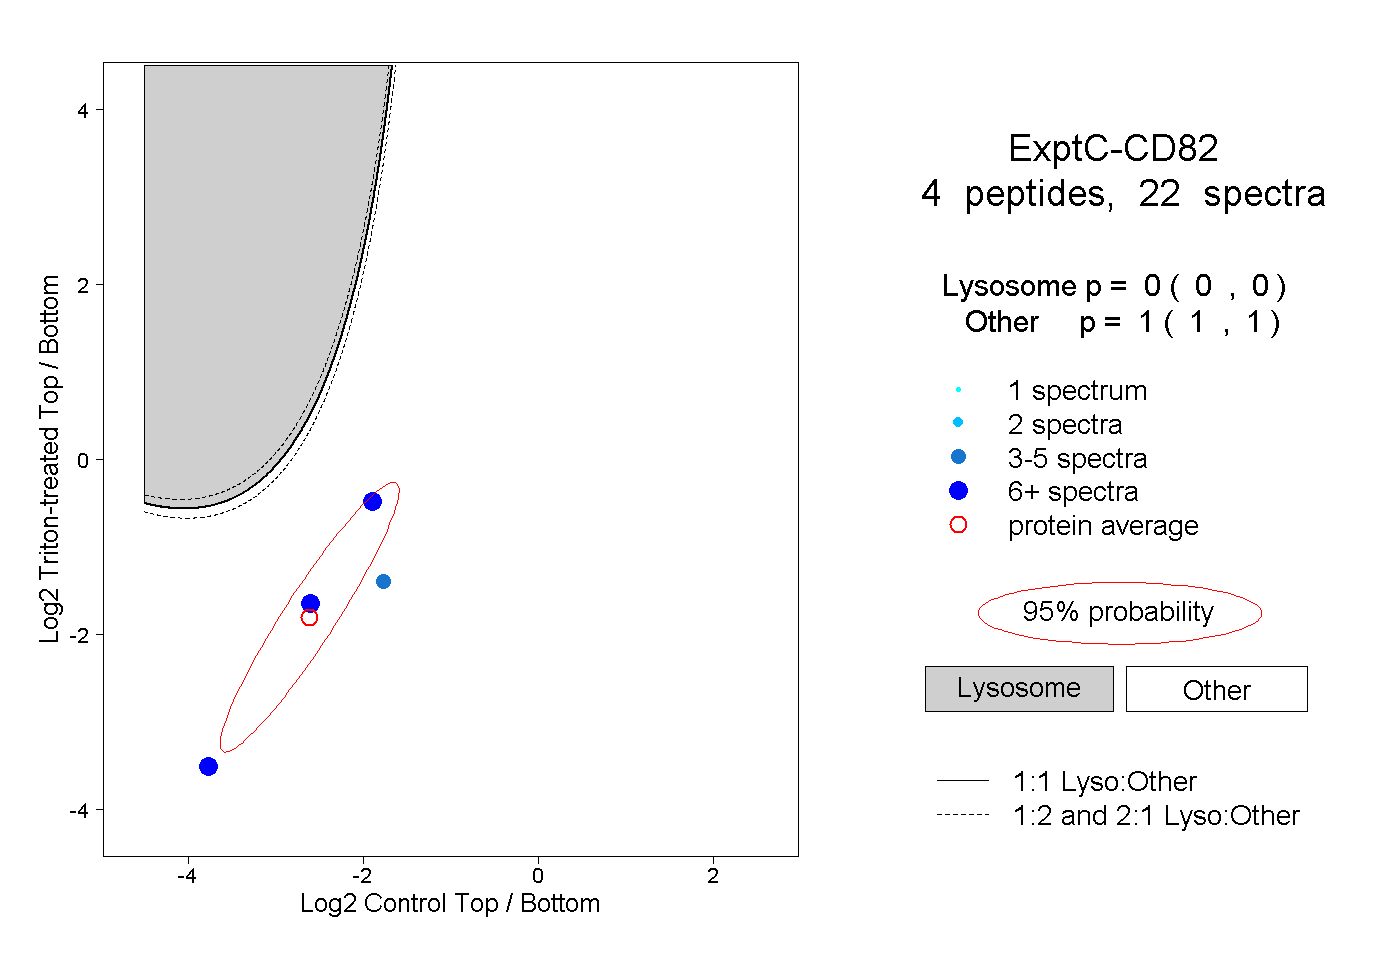 |
0.000 0.000 | 0.000 |
1.000 1.000 | 1.000 |