 3
3peptides
spectra
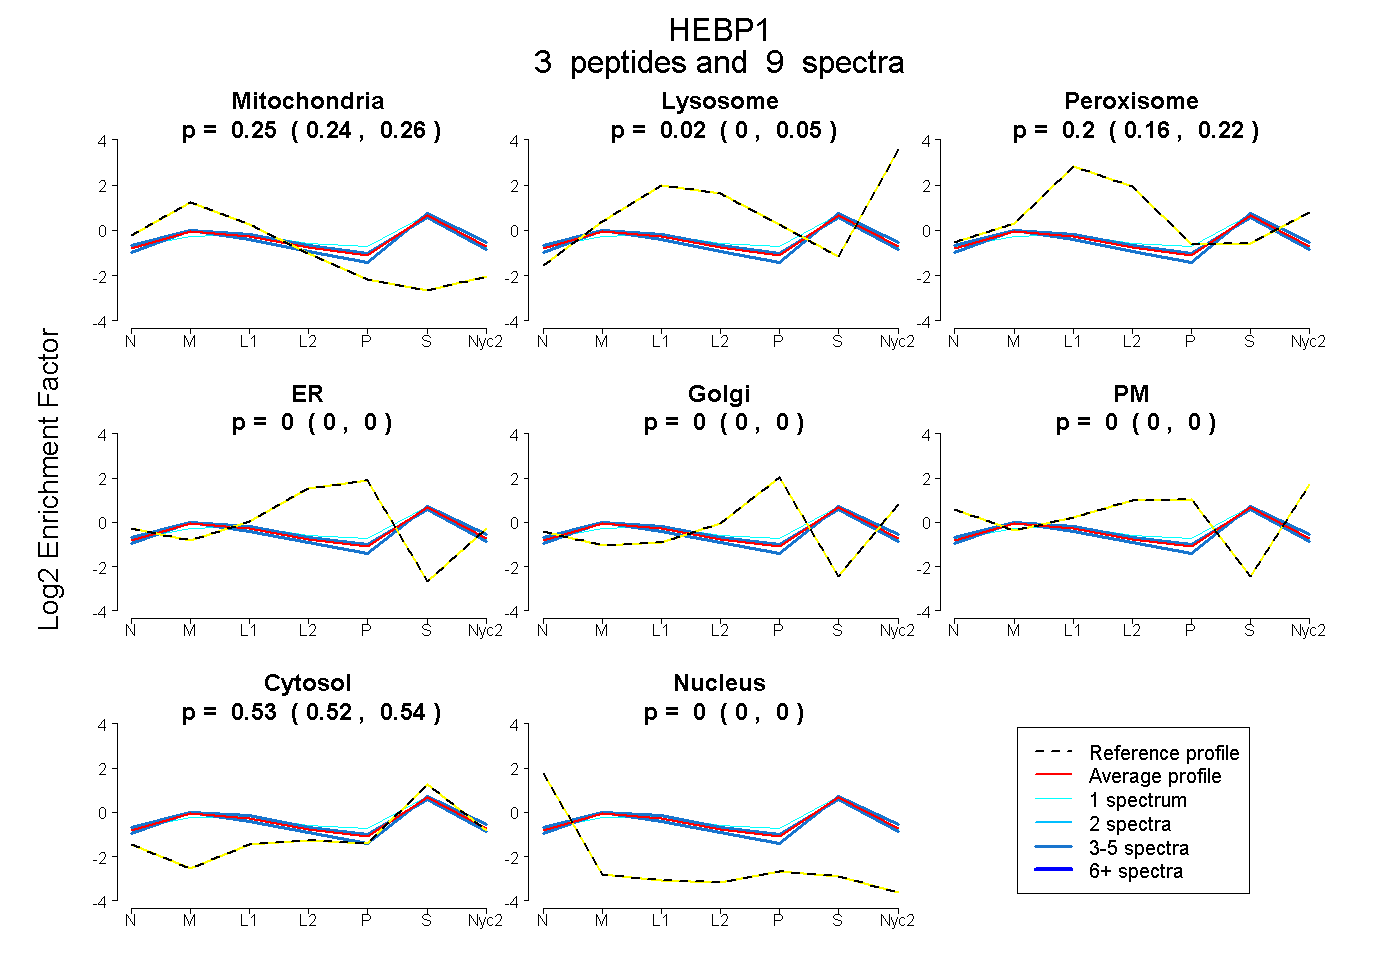
0.238 | 0.262
0.000 | 0.051
0.163 | 0.220
0.000 | 0.000
0.000 | 0.000
0.000 | 0.000
0.522 | 0.537
0.000 | 0.000
2peptides
spectra
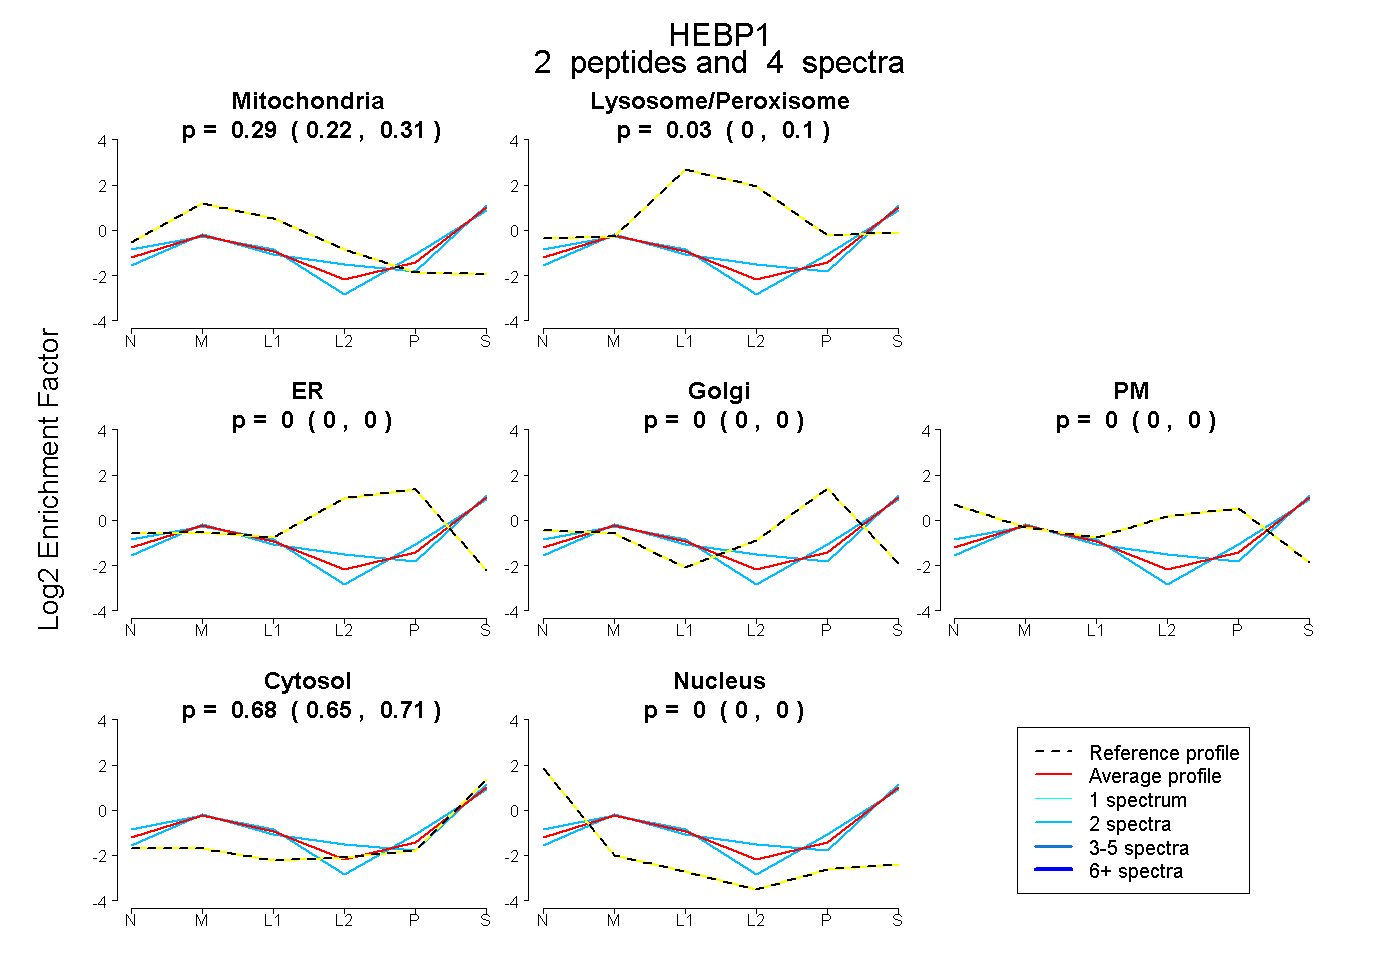
0.223 | 0.312
0.000 | 0.102
0.000 | 0.000
0.000 | 0.000
0.000 | 0.000
0.650 | 0.712
0.000 | 0.000
4peptides
spectra
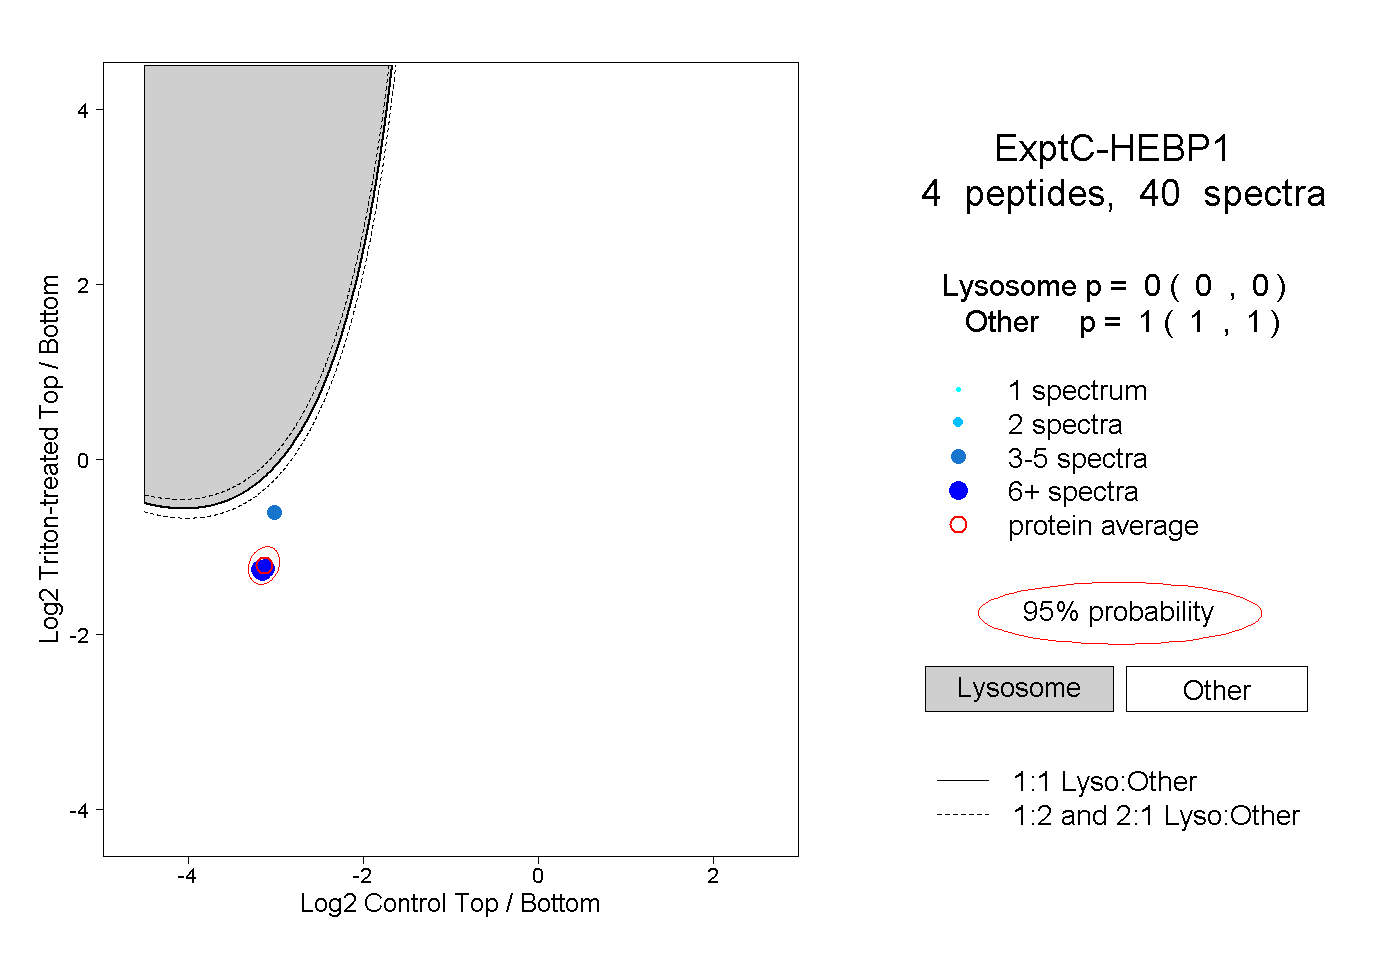
0.000 | 0.000
1.000 | 1.000
1peptide
spectrum
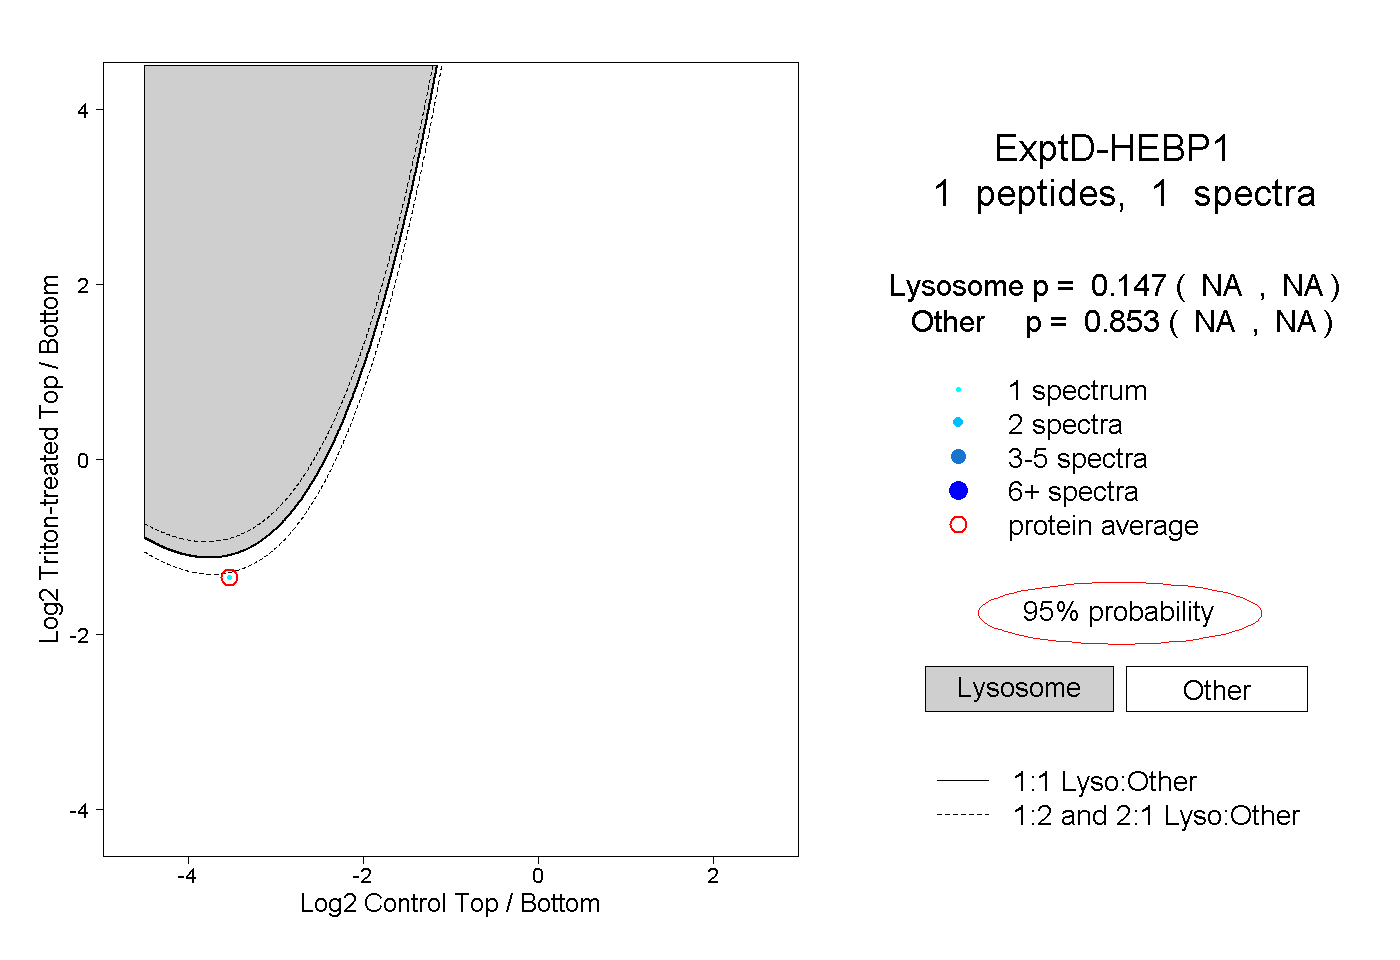
NA | NA
NA | NA