 3
3peptides
spectra
0.238 | 0.262
0.000 | 0.051
0.163 | 0.220
0.000 | 0.000
0.000 | 0.000
0.000 | 0.000
0.522 | 0.537
0.000 | 0.000
| Plot | Mito | Lyso | Perox | ER | Golgi | PM | Cytosol | Nucleus | |||||
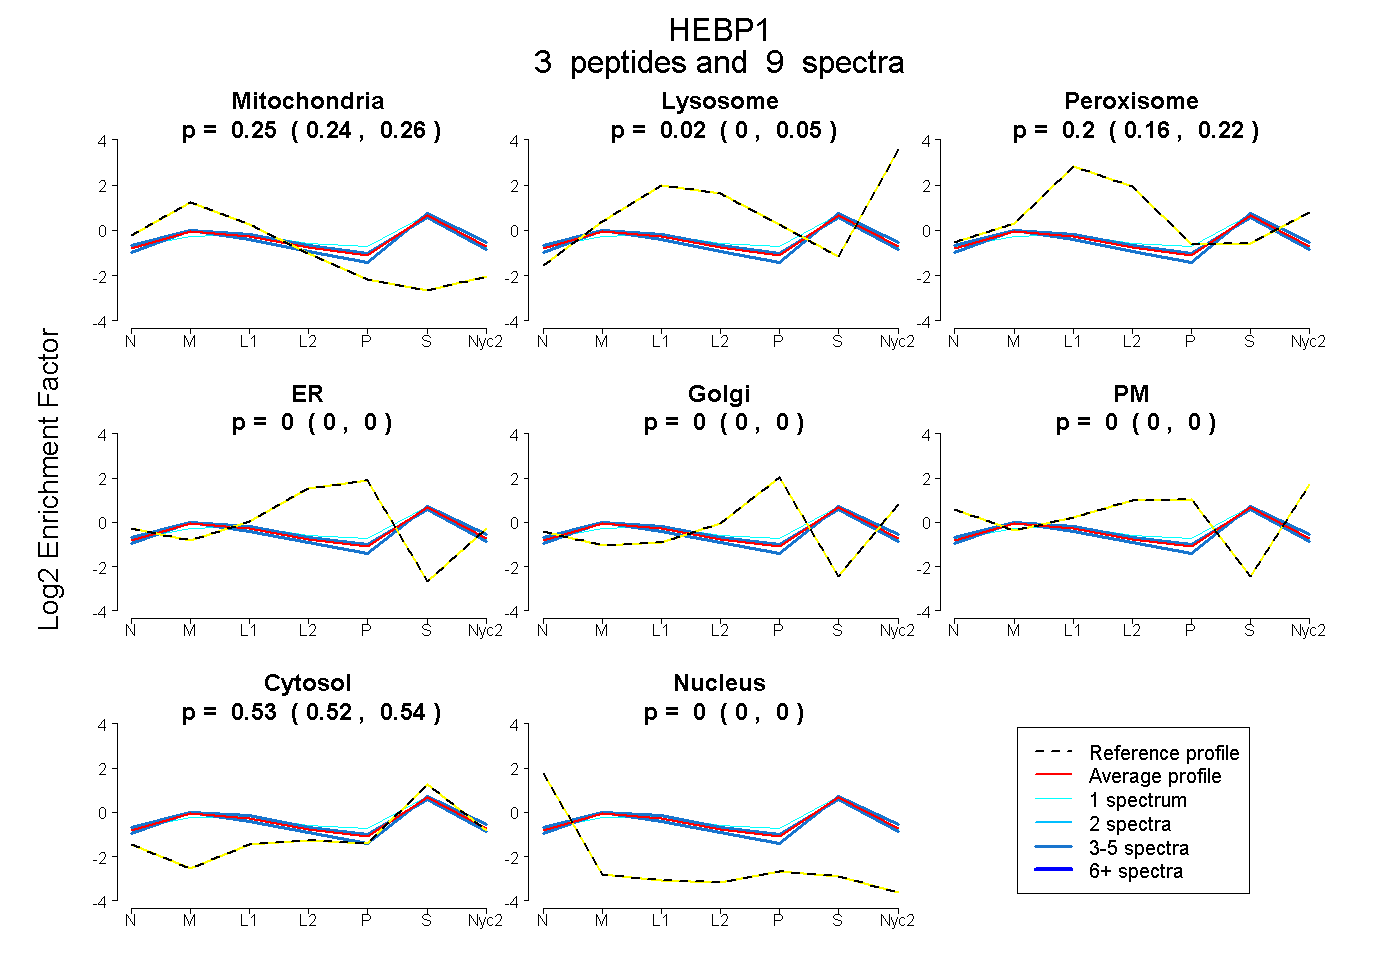
| Expt A |
3 peptides |
9 spectra |
|
0.250 0.238 | 0.262 |
0.022 0.000 | 0.051 |
0.197 0.163 | 0.220 |
0.000 0.000 | 0.000 |
0.000 0.000 | 0.000 |
0.000 0.000 | 0.000 |
0.530 0.522 | 0.537 |
0.000 0.000 | 0.000 |
| 4 spectra, YVGGTNDK | 0.262 | 0.000 | 0.236 | 0.000 | 0.000 | 0.000 | 0.502 | 0.000 | ||
| 4 spectra, EDVSYEER | 0.268 | 0.077 | 0.104 | 0.000 | 0.000 | 0.000 | 0.552 | 0.000 | ||
| 1 spectrum, ACEGGK | 0.184 | 0.000 | 0.254 | 0.000 | 0.024 | 0.000 | 0.538 | 0.000 |
| Plot | Mito | Lyso or Perox | ER | Golgi | PM | Cytosol | Nucleus | ||||||
| Expt B |
2 peptides |
4 spectra |
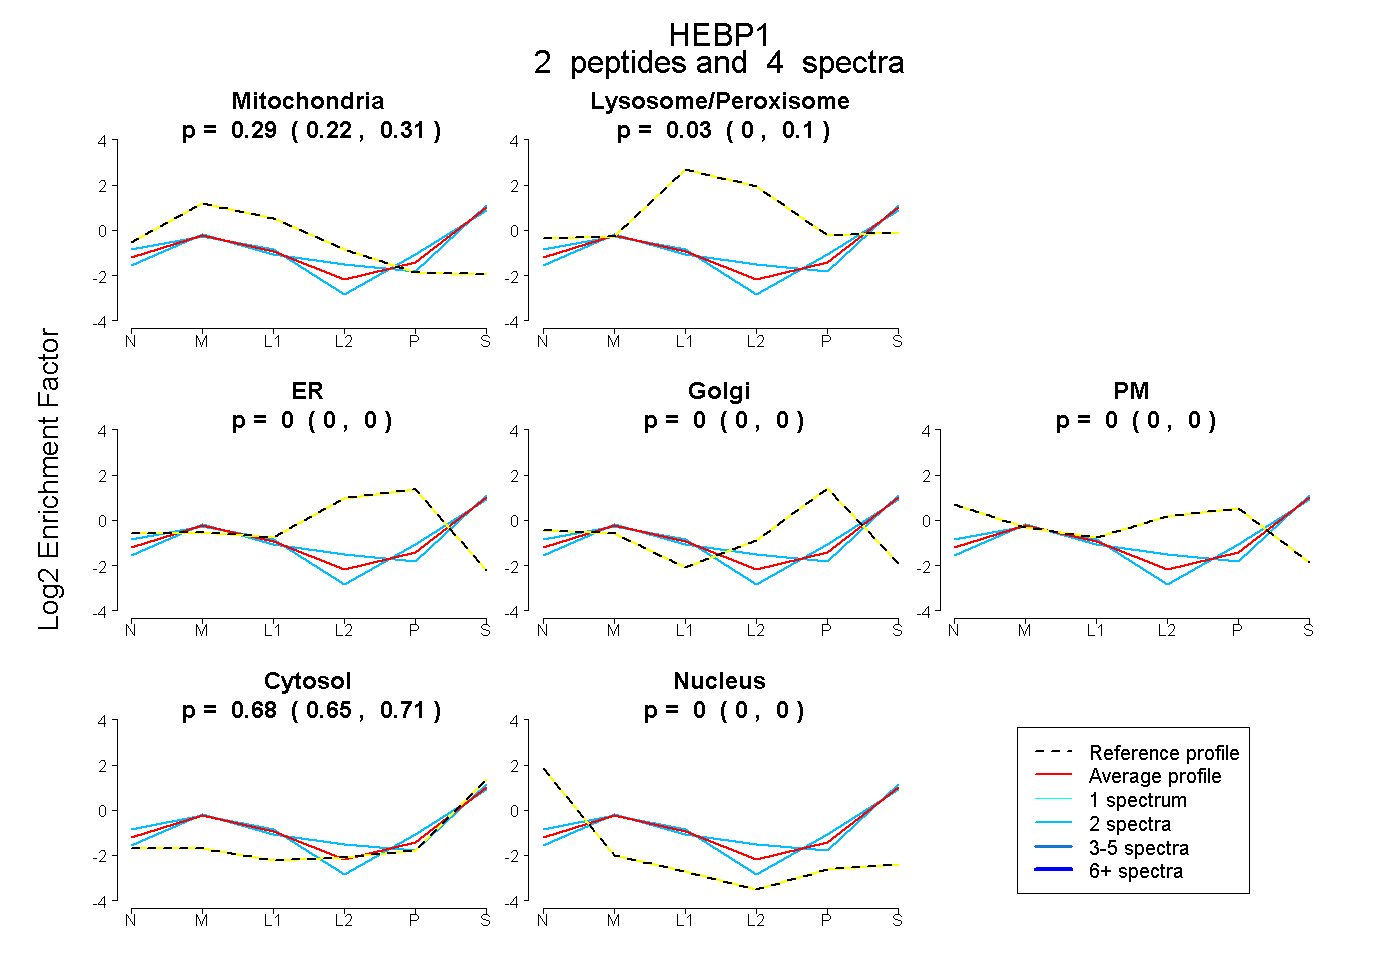 |
0.285 0.223 | 0.312 |
0.030 0.000 | 0.102 |
0.000 0.000 | 0.000 |
0.000 0.000 | 0.000 |
0.000 0.000 | 0.000 |
0.685 0.650 | 0.712 |
0.000 0.000 | 0.000 |
|||
| Plot | Lyso | Other | |||||||||||
| Expt C |
4 peptides |
40 spectra |
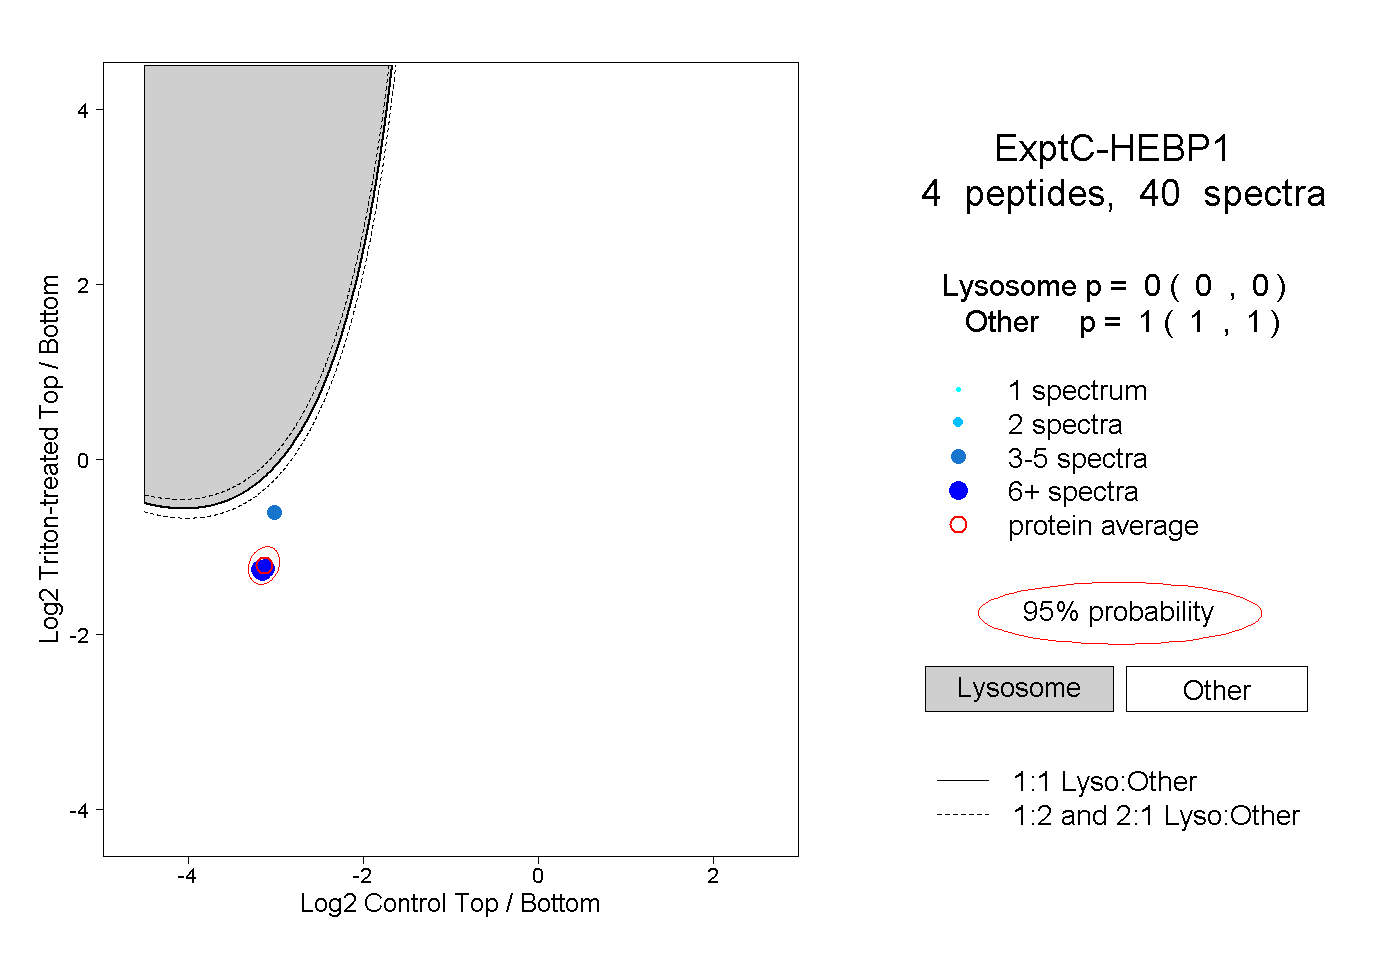 |
0.000 0.000 | 0.000 |
1.000 1.000 | 1.000 |
||||||||
| Plot | Lyso | Other | |||||||||||
| Expt D |
1 peptide |
1 spectrum |
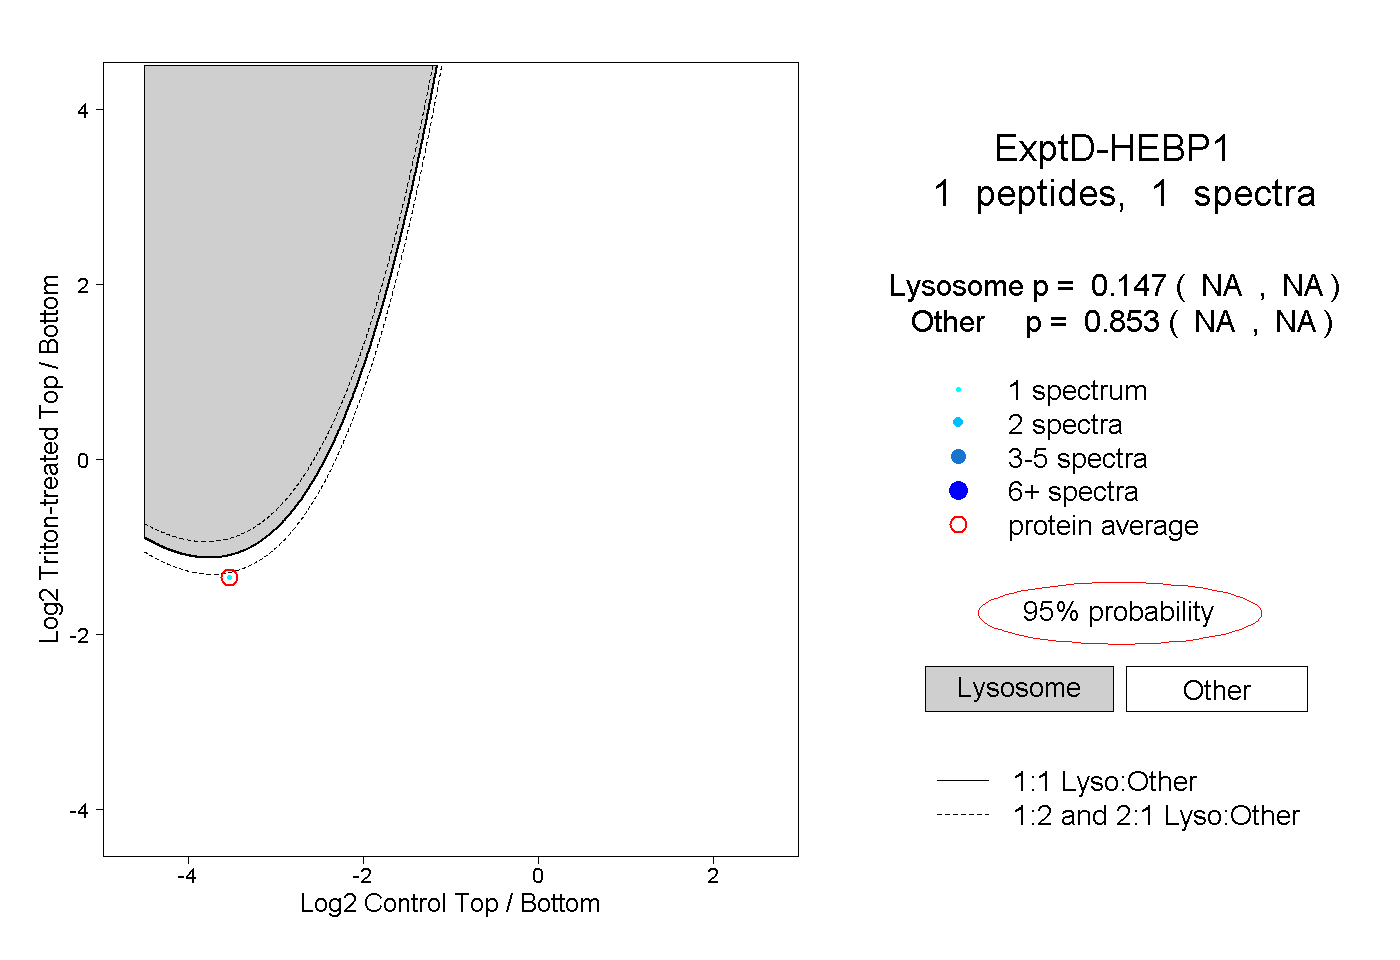 |
0.147 NA | NA |
0.853 NA | NA |